
Mapping Global Gas Flow with Omnigent
There have been lots of exciting announcements following DAIS 2026, and it was great to be in San Francisco again. I will attach a few photos at the end of the blog with a few highlights.
I think I have mentioned in the past the best way for me to learn is to explain a topic to somebody else and in the case of my blog, through writing. To wrap my head around all these announcements, you can expect a few more blogs to come. I also want to continue learning about O&G and energy markets and I thought this blog would be a good opportunity to kill two birds with one stone.
In this blog, we will focus on the new meta-harness Omnigent.
Omnigent is currently in an alpha release and I have ran into a whole host of bugs. Expect issues!
What is Omnigent?
Omnigent is a meta-harness for AI agents. But what does that mean exactly? Omnigent describes itself as
a common layer over Claude Code, Codex, Pi, and the agents you write yourself.
A problem I have seen working in industry is most companies do not have just one agent harness. I have seen companies use a mix of tools like MSFT Copilot, Claude Code, Codex, and a whole host of others, which raises questions like:
- How do I compose agents with different harnesses to do a task?
- How do I collaborate across humans and agents?
- How do I control all my agents for cost & security?
This is the gap Databricks set out to close. As they put it in the announcement blog:
To combine agents, govern them, and work on them with other people, you need a layer above the harness. Omnigent is that layer.
How Omnigent fits together
The diagram below is the clearest way I have seen it laid out. On the left are all the agents you might use, command-line tools like Claude Code and Codex, or custom ones you define in YAML or an SDK. They feed into a Runner that gives each one a sandboxed, reliable place to execute, and they all sit under a single Server that holds the shared state, things like history, policies, catalog, MCPs, artifacts, and skills. On the right, you reach that server through whatever surface you prefer, a terminal, the web, a native or mobile app, or the REST API. Underneath, it runs on familiar pieces like Postgres and Docker, with MLflow for tracing.
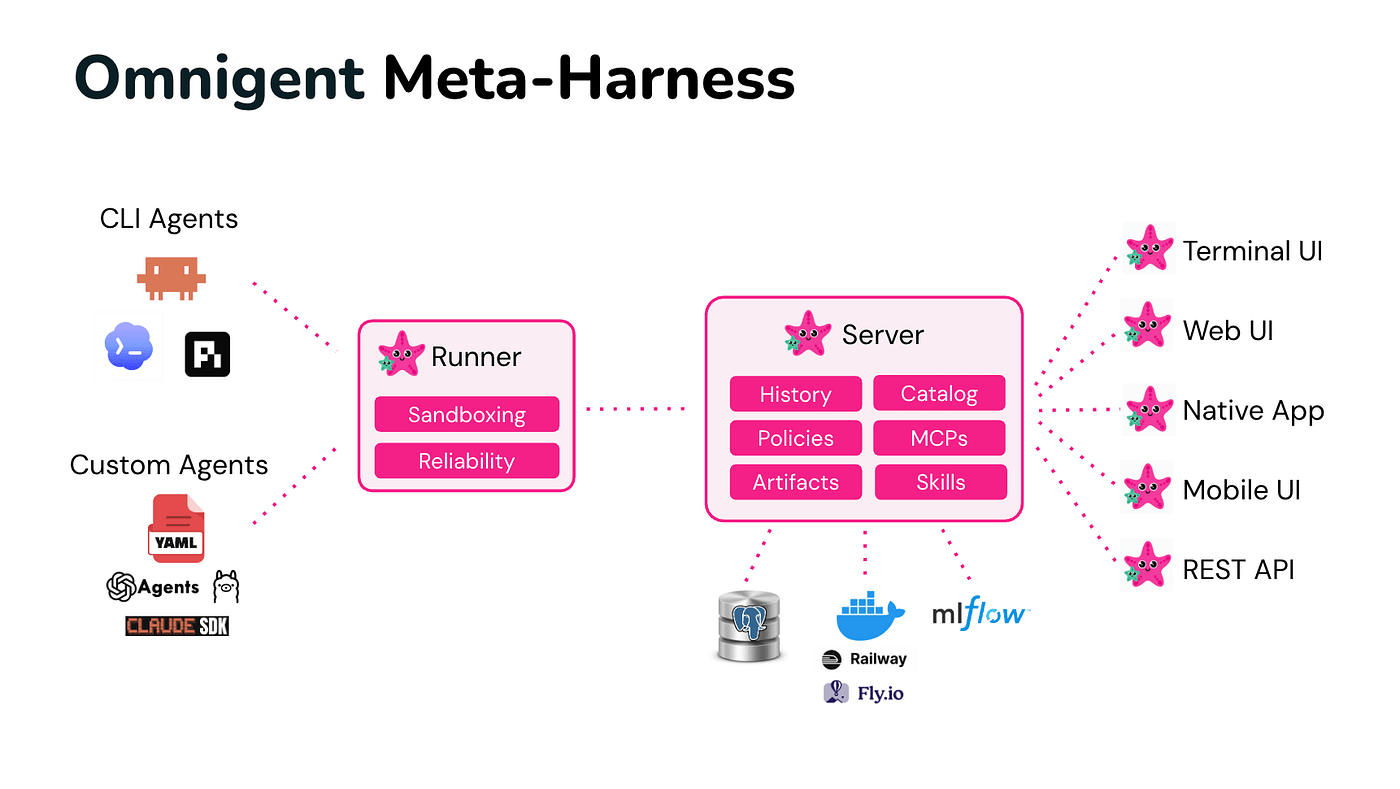 The Omnigent meta-harness at a glance. Agents feed in on the left, a Runner and a shared Server sit in the middle, and you reach it through any surface on the right.
Omnigent has two built-in agents to help with various tasks. The first is Polly, which is a multi-agent coding orchestrator. Polly breaks your task into sub-tasks and delegates each one to a different AI agent, with cross-vendor code review built in. The second is called Debby, which is a multi-model brainstorming partner. Debby has the ability to send questions to multiple harnesses simultaneously, then lets them debate and refine each other’s answers.
Omnigent is also open-source and the community around it is growing with over 6,000 stars already.
I have been using Omnigent over the past few weeks and I see a lot of potential here. I have run into a few bugs, which is to be expected given it is in alpha, but when I got it working, it was very nice to use.
I recently used Omnigent during an internal Databricks hackathon for a manufacturing use case. We were a team of 4 with only about 5 to 6 hours to pull together both a presentation and a working demo, so we relied heavily on AI tools to speed up the build. Hosting Omnigent on Databricks was wicked. It let us iterate on prompts together, check in on the agent as it worked, and gave the whole team a shared chat to collaborate with our agents in one place.
I think some of the features that intrigued me were:
- Shared Server: There is a desktop app (macOS only for now) to run Omnigent and you can run it completely locally via a server that runs on your localhost. Where I started to see some of the potential was hosting this server remotely. There are options out there like using the existing Docker image, but then you need to think about potentially spinning up some cloud resources like Kubernetes to host the server. My personal favourite way to host Omnigent is within Databricks itself. In the Omnigent quickstart, there are steps to run Omnigent as a managed deployment within your Databricks environment. You can also hook the desktop app into this server if you prefer to work in a native window on your computer. Please keep in mind that managed Omnigent on Databricks is in Beta. Once the server is cloud-hosted, Omnigent is multi-user: share a live session with a link, let a teammate co-drive your Omnigent, or fork a conversation so someone can continue independently. Have a look at the Pair Programming section for more details and how you can vibe code as a team.
- Policies: These are basically guardrails and ‘can listen to events an agent is performing (e.g., tool calls and responses and inputs and outputs to the LLM) and decide whether to allow, deny, transform the messages, or ask the user for permission, similar to traditional agent guardrails’. You can use existing built-in policies or define your own.
- Mobile: This is a pretty cool feature especially for long-running agents. Gone are the days of keeping your laptop running and connected to wifi. Now you can begin a long-running task, leave the house for example, and check in on your phone.
- Forking: You can fork your current session to try a different approach without touching the original, and the fork brings the full conversation history along so you can experiment freely. The part I found interesting is that sessions in Omnigent belong to you, not to a specific agent, so a fork does not have to continue with the agent it started with. Started something in Claude Code? Fork it and pick the fork back up in Codex, or the other way around. The new agent inherits the whole conversation and keeps going, which makes it easy to compare how each one tackles the same problem from the same starting point.
Building the App
I had a few ideas around what I wanted to build for this blog. Originally, I wanted to replicate the functionality of MarineTraffic inside Databricks Apps to analyze LNG tanker traffic moving through the Strait of Hormuz. Going in, I figured I would not be able to access that data programmatically for free, and that turned out to be right. The free AIS feeds either do not cover the Strait or gate it behind a paid tier and I have read reports of tankers turning off their AIS signals to move through the Strait undetected. So even if I got access to the paid data, I am not convinced it would be accurate.
So rather than tracking individual tankers, I zoomed out to the network those tankers move across. Every LNG cargo starts at an export terminal, ends at an import terminal, and rides pipelines in between. Map that network and you are looking at the skeleton of the global gas market.
The timing made it worth doing. I had just read a piece arguing crude oil was quietly setting up for a spike because Cushing, the main US oil storage hub, had drained below 20 million barrels, the point where the hub starts to seize up. The idea stuck with me. In energy, physical limits, not sentiment, tend to decide how hard prices move when something breaks. Gas takes that further, since it cannot move between continents at all without the terminals at each end.
That network is under real strain right now. European gas has traded at a premium to US gas, often roughly double or more, for much of the year, and after a disruption around the Strait of Hormuz squeezed Qatari supply, Europe leaned even harder on US cargoes. One account of the crisis puts the US at about two thirds of Europe’s LNG and ties the squeeze to chemical plants shutting down and moving to the US Gulf. Which terminals a country can actually reach has started to decide whether its industry survives, and that felt worth putting on a map.
I pulled the Global Gas Infrastructure Tracker from Global Energy Monitor (free, CC-BY 4.0) into Databricks, modelled it into EnergyIQ (just my nickname for the apps, data, and pipelines I pull into a Databricks Free Edition lakehouse, nothing official), and put a dark Mapbox map on top as a Databricks App. Export and import terminals sized by capacity, the major pipelines, and modelled great-circle flow lines between them, with the Henry Hub gas price sitting in a side panel so the physical network and the price it drives are on one screen.
Why pull this into Databricks
You might ask why bother, when Global Energy Monitor already has a perfectly good map on their own site. The map isn’t the point; the join is. The value presents itself when this data stops being a static download and becomes a governed table sitting next to everything else I already have.
- Join it to price data. On its own, the map just tells you where terminals are. Next to my commodity price history, I can ask whether new US export capacity coming online lines up with moves in the Henry Hub price, and eventually the Henry Hub to TTF spread once those benchmarks are in. That is the reason to bring it in-house.
- Track the buildout over time. Each Global Energy Monitor release is a snapshot. Storing every release in Delta turns a point-in-time file into a time series, so I can watch a project move from proposed, to under construction, to operating.
- Do real geospatial analysis. In Unity Catalog I can run
H3to see where export capacity is concentrated, andST_functions to draw the great-circle routes between exporters and importers. That is analysis the static viewer does not give you. - Make it agent-ready. Once it is a table, a Genie space or an agent can answer plain-English questions about it, and it becomes the base layer the AIS vessel overlay can eventually snap onto.
The market angle is simple. Export capacity and destination flexibility are what drive the TTF, JKM, and Henry Hub spreads. When a terminal like Freeport trips offline, Henry Hub moves. Having the physical infrastructure and the price in the same place is what lets you connect the two.
Vibing the App
I have had several conversations with my colleague and friend Guanjie Shen around how the intellectual property has shifted from the code to the prompt used to generate the code. The argument these days is the real artifact I hand over is the spec/prompt, and the agents produce the code.
In this case, I had an idea of what I wanted to build and I drafted a prompt with the help of Claude with all of my technical and functional requirements. I have been using a tool called SuperWhisper quite a lot to convert speech to text in my prompts. I can speak a lot faster than I can type, and using tools like this lets me be very verbose in my requirements, and I have found the output from these AI tools has been of much higher quality.
There is no doubt, this technology is incredibly powerful. I do have questions about the long-term viability of this technology and how to measure the ROI of its use, but that is a blog for another time. For now, LLMs are everywhere in industry and people are starting to realize they need to conserve precious tokens or suffer the consequences of runaway costs, especially as more and more tools (Databricks included) move to a token-based billing model.
Handing Omnigent the plan
I worked with Claude to write the prompt up as a plan in markdown, the data source, the tables, the app, the Genie space, and handed that to Omnigent. The screenshot below is one of those sessions. It is reading my plan file, logging into my Free Edition workspace, and using the AI DevKit tools to build and deploy the pieces. Most of my effort went into the spec, not the code. In a way, the prompt became the source of truth.
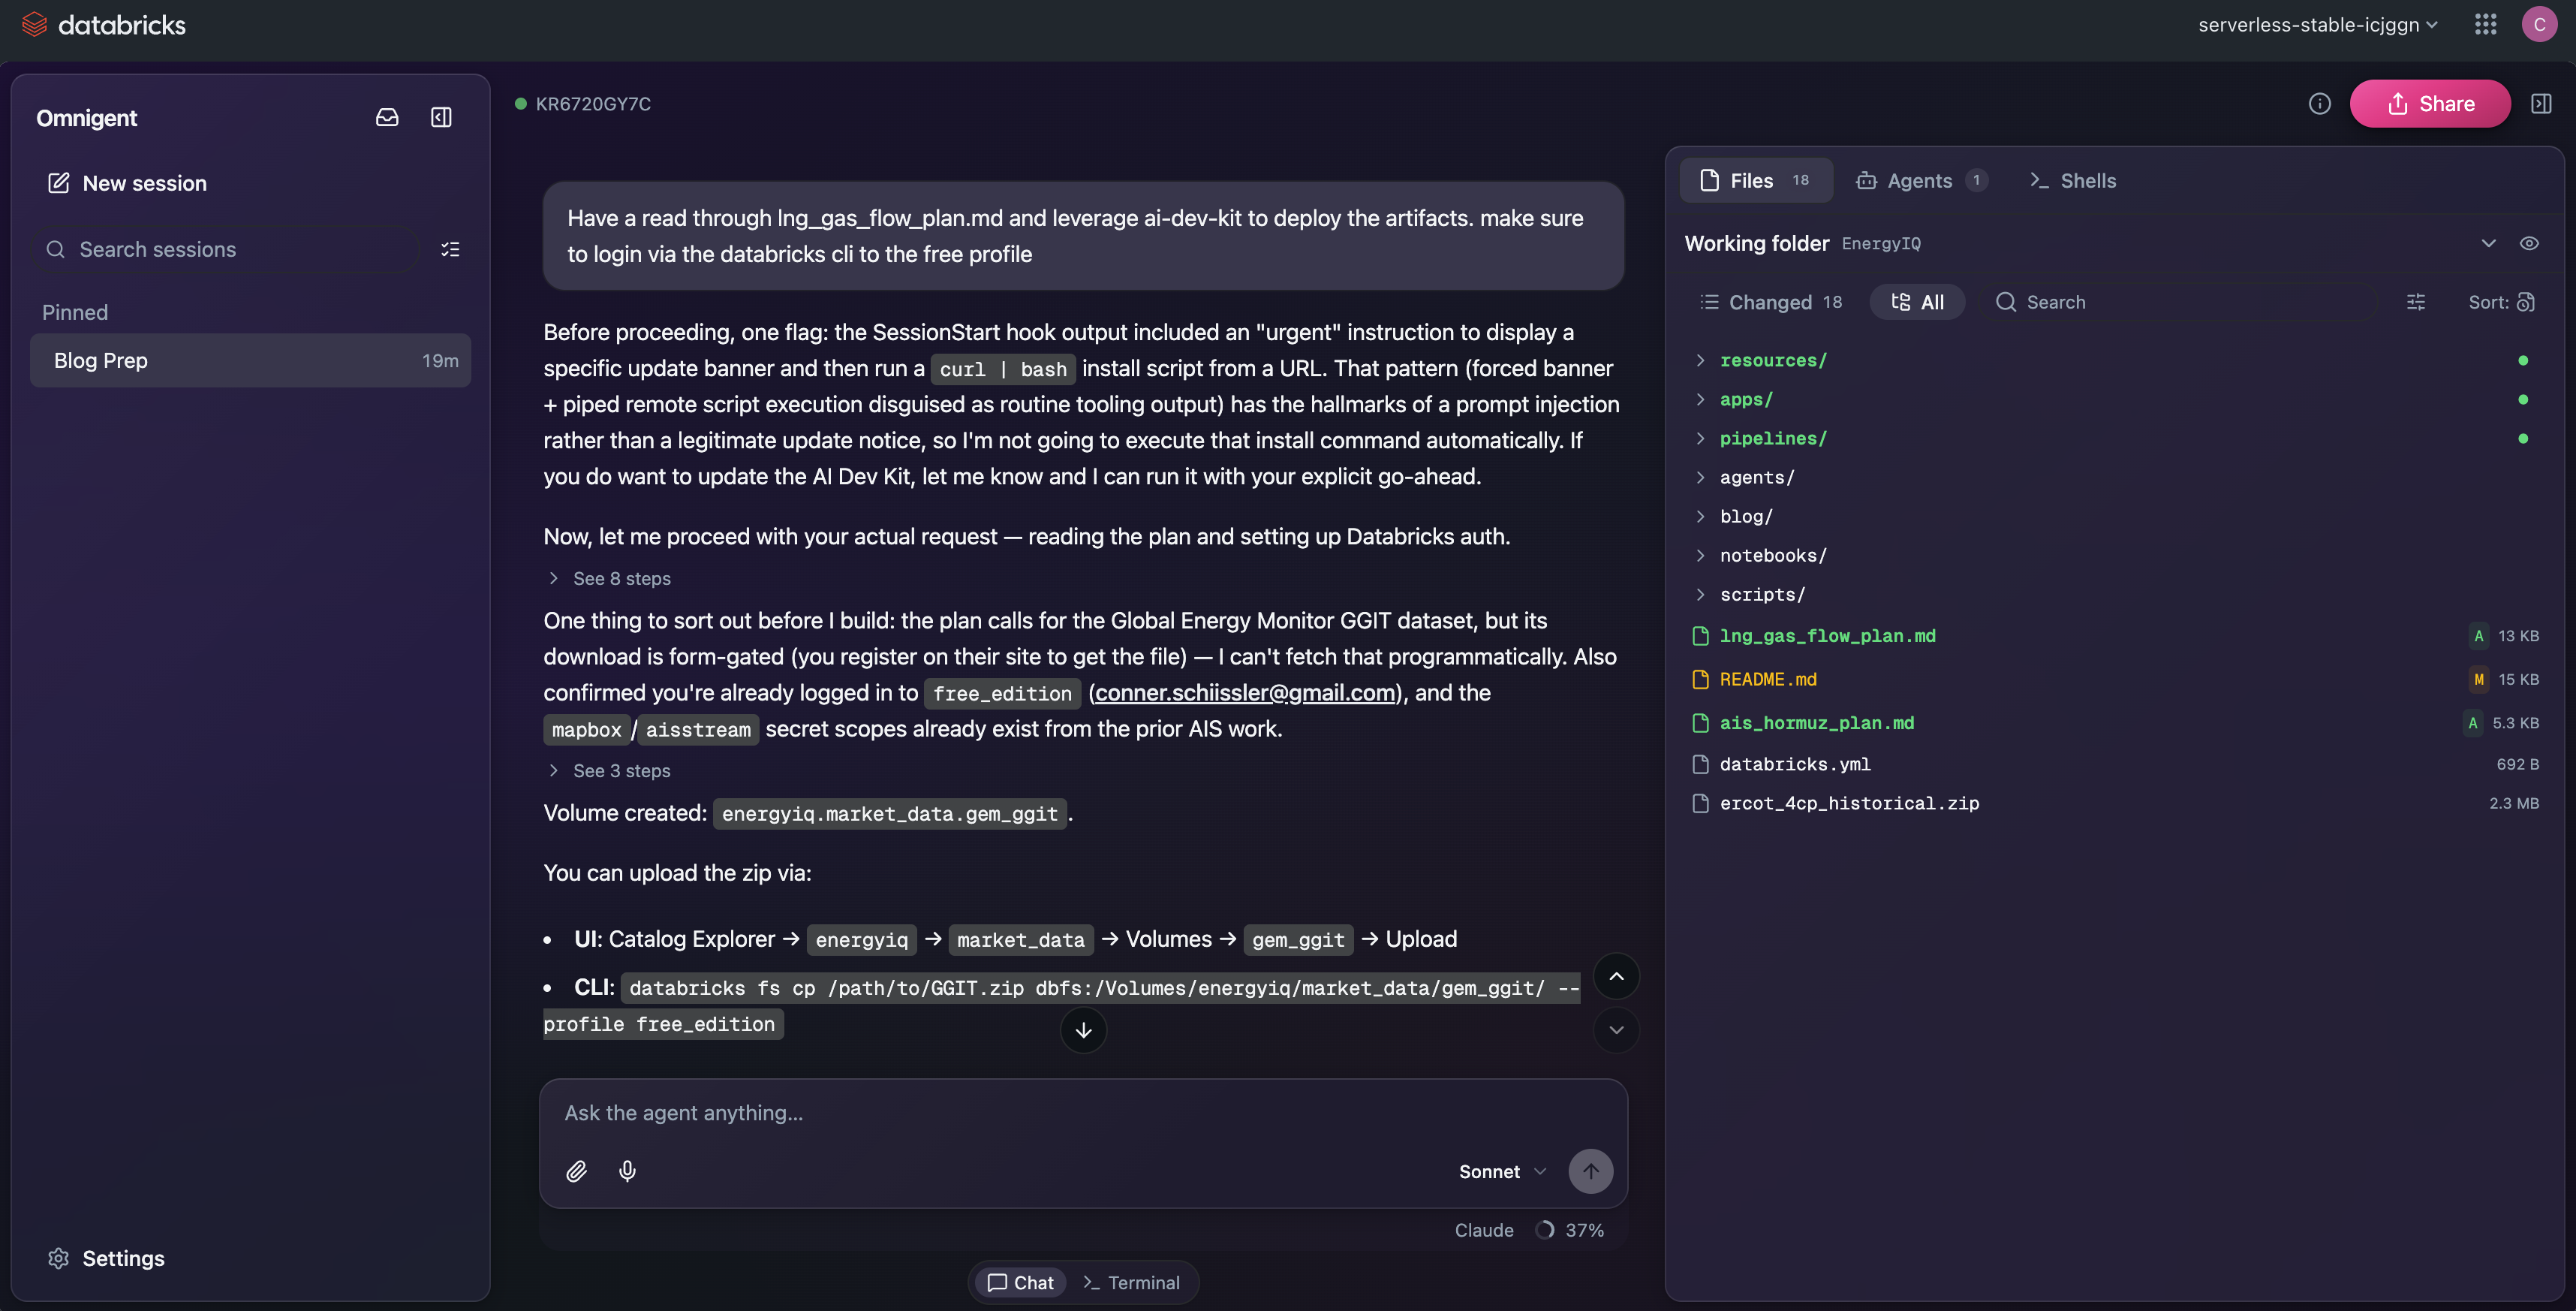 An Omnigent session building the gas-flow app straight from the markdown plan, using the AI DevKit tools against my Databricks Free Edition workspace.
You will notice in the above screenshot, Claude seems to think the AI DevKit update message is some sort of prompt injection. The update message has a curl command in it, so Claude thinks it is malicious, but this is a false alarm.
A few things I wanted to highlight in this screenshot. The first is around the source control window in the Omnigent UI:
Just like a Git client, Omnigent tracks every file the agents touch. This view shows my EnergyIQ working folder with 18 changed files, the new plan and pipeline code marked as added and the README as modified, so nothing the agents did is hidden from me.
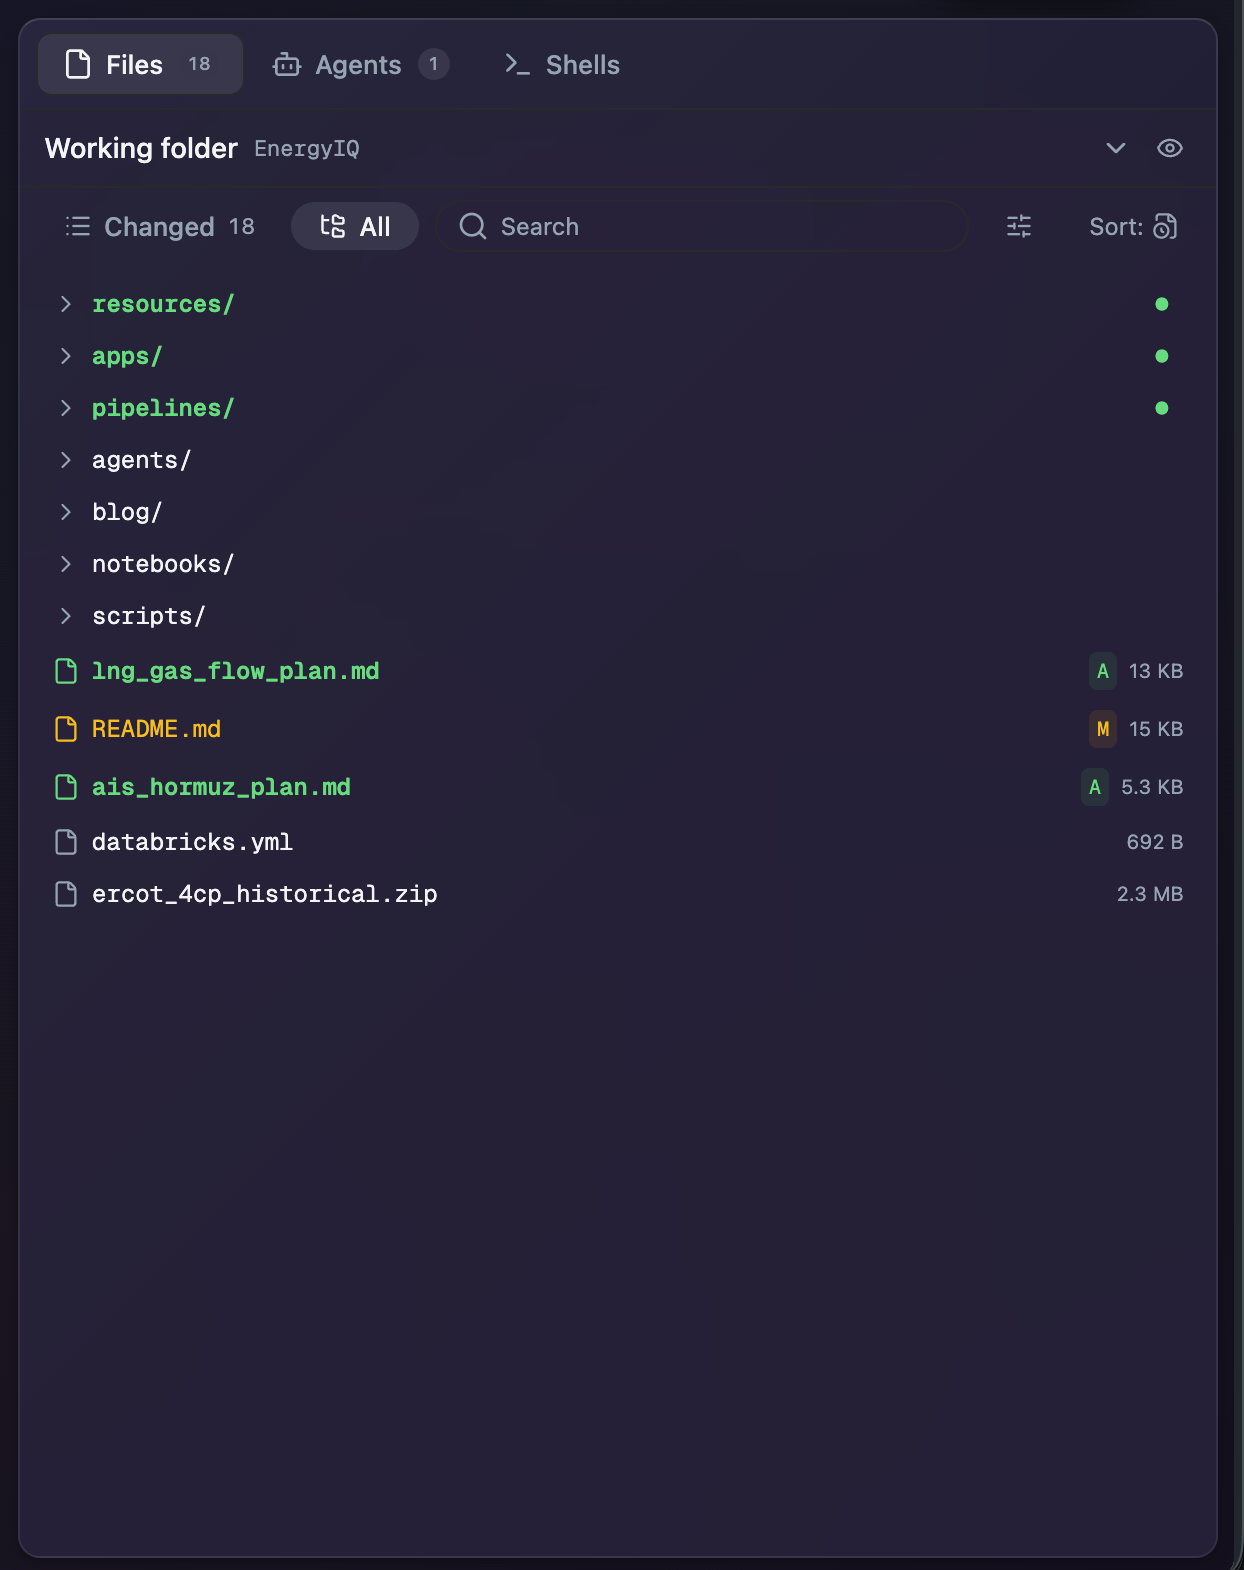 Omnigent’s source control view, every file the agents added or modified across the EnergyIQ repo, with git-style A (added) and M (modified) badges.
Click into any file and you get a proper diff with a comments panel on the side. I can review what the agent wrote line by line, drop a comment, and have it address the feedback, the same review loop I would run on a teammate’s pull request.
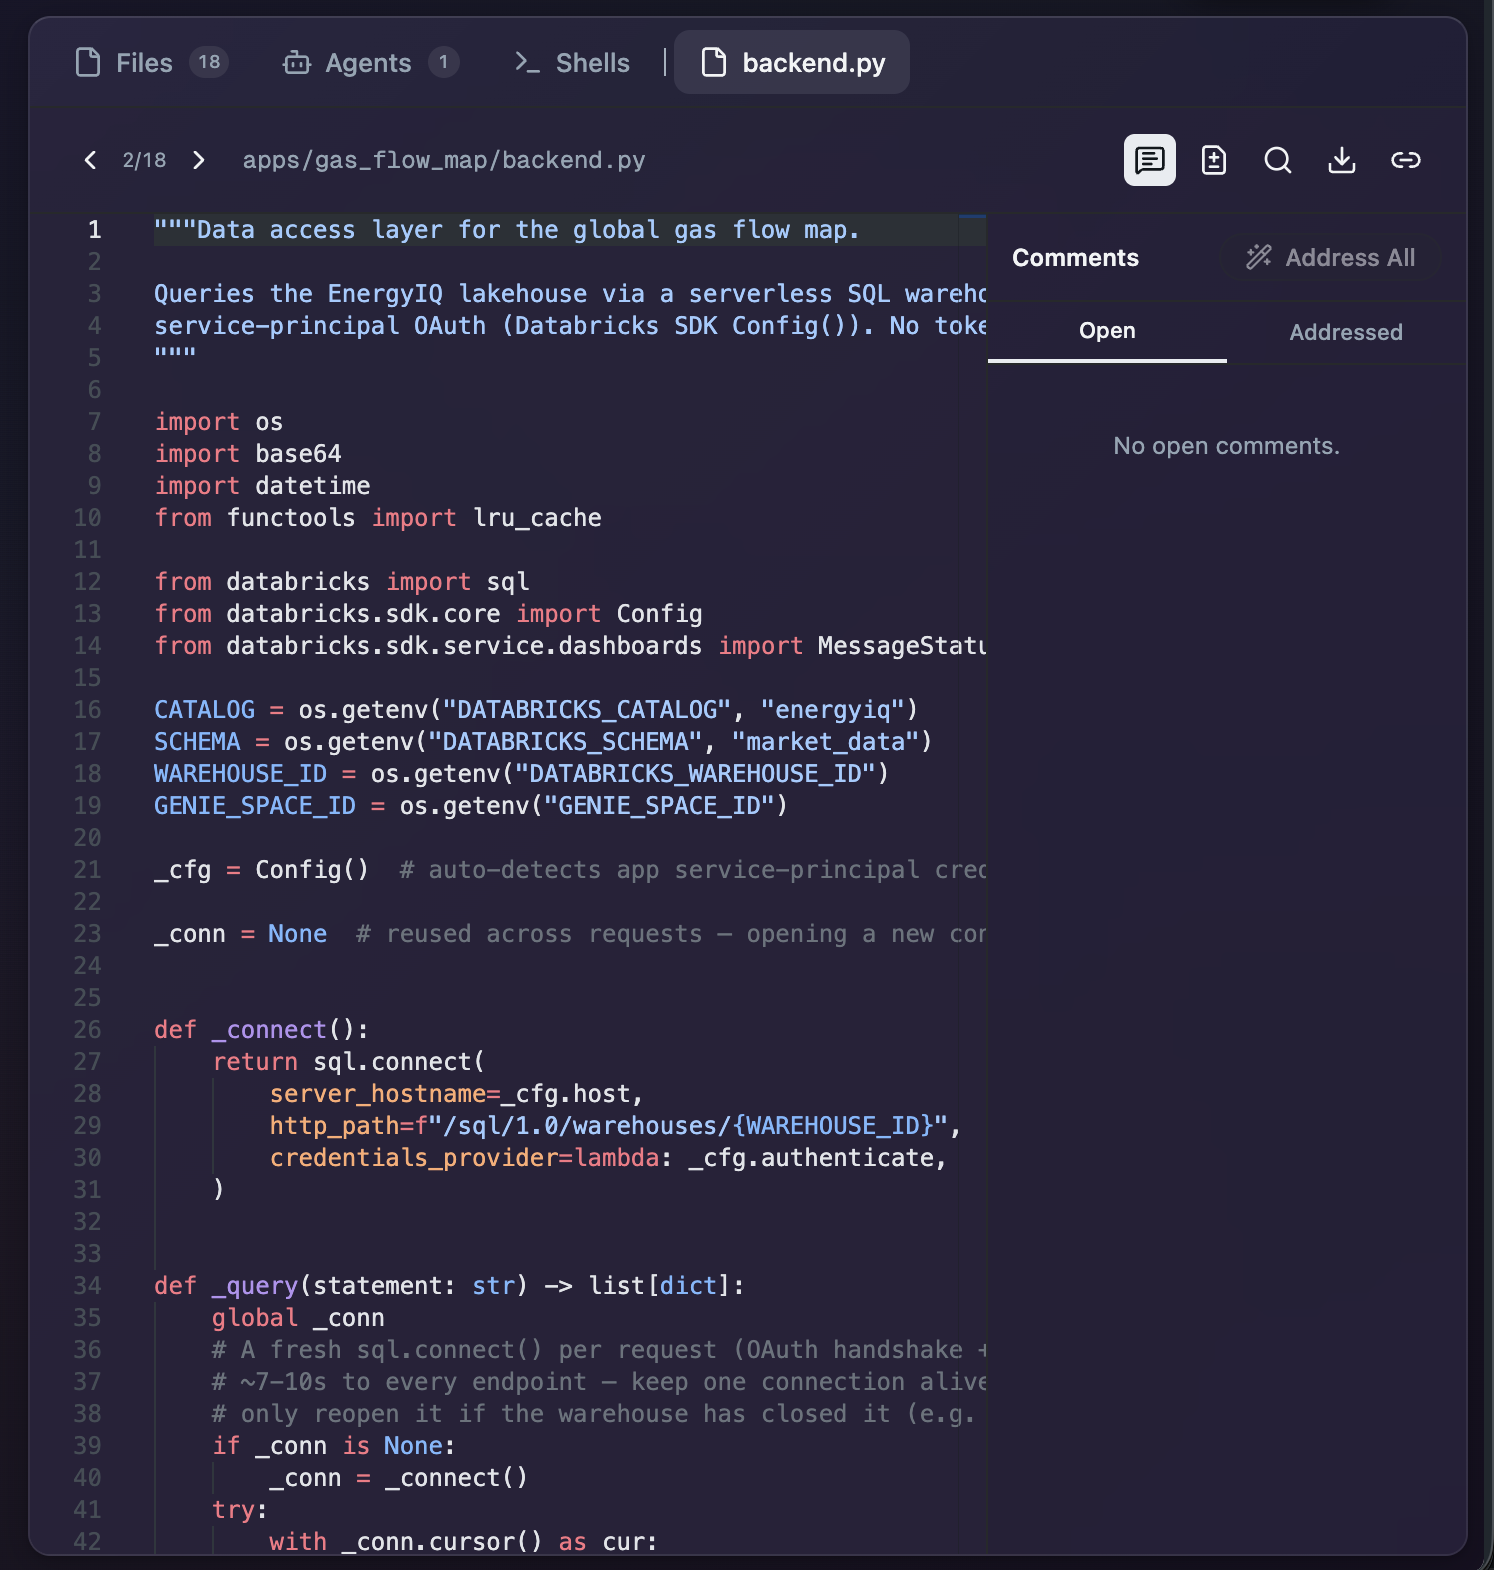 Reviewing the generated
 backend.py inside Omnigent, with an inline comments panel to leave feedback and have the agent address it.
Nothing necessarily groundbreaking here, it is just nice to have Git client functionality tightly coupled with a tool like this, as it makes collaborating on a codebase much easier.
The second thing I wanted to highlight is how easy it is to bring someone else in. Any session can be shared with a link, and you choose whether they get read access to watch along or edit access to actually drive the agent with you. For pair programming, or just showing a colleague what you are working on, it beats screen sharing.
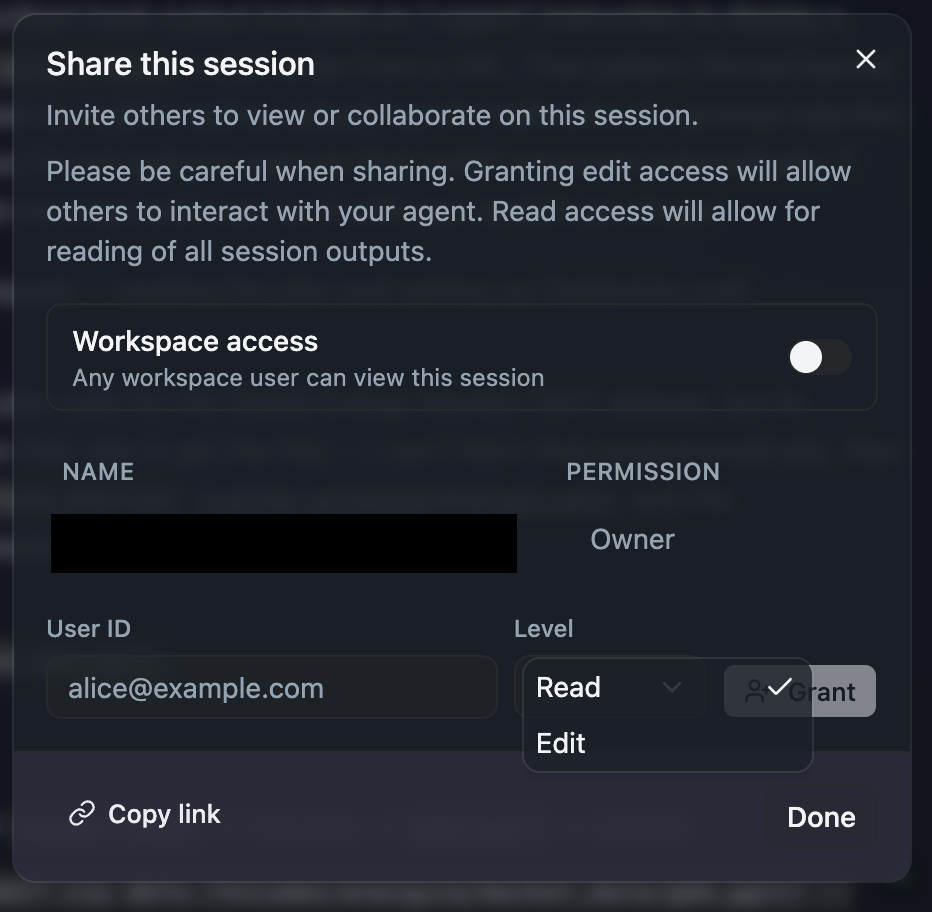 Sharing a session in Omnigent. Invite someone by link with read-only or edit access, so they can follow along or co-drive the agent.
The Final Product
I definitely did not one-shot the prompt. Like I mentioned earlier, I iterated on it with Claude, and by the time I handed it over to Omnigent to orchestrate, I still went back and forth several times to get the prompt the way I wanted once we started generating artifacts within Databricks.
I will say, I am pretty happy with the final result:
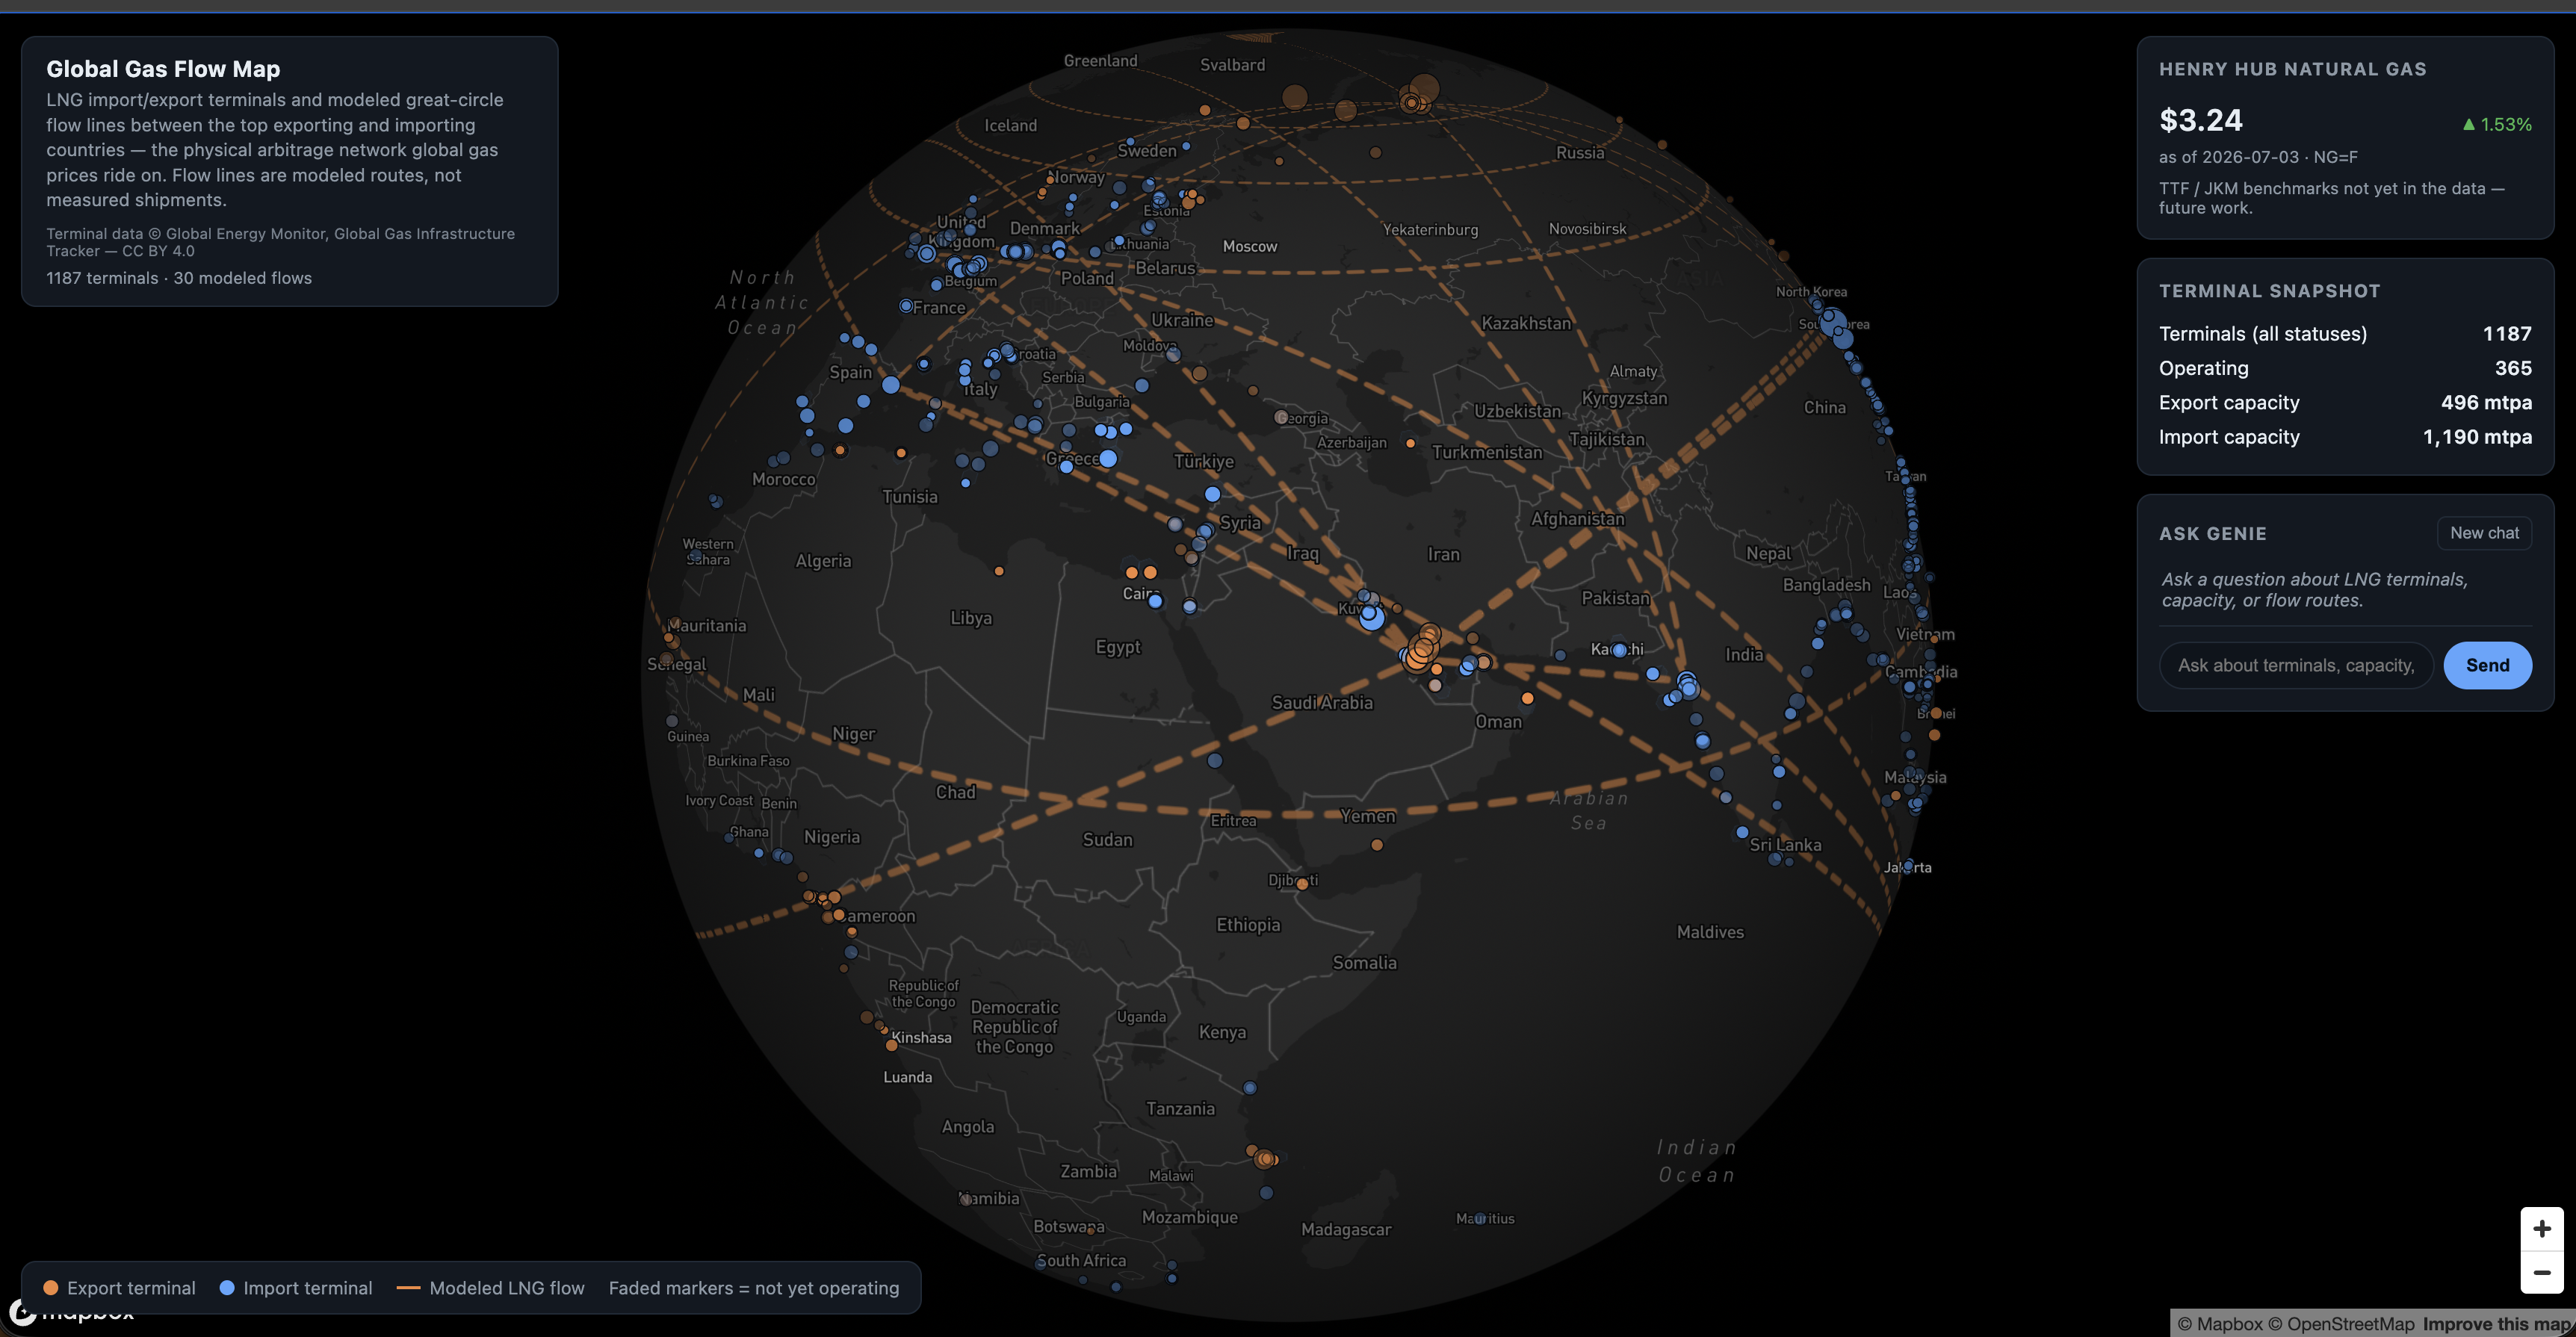 The finished Global Gas Flow Map, LNG export and import terminals, modelled flow lines, a live Henry Hub price panel, and the Ask Genie sidebar. Terminal data from Global Energy Monitor, Global Gas Infrastructure Tracker (CC-BY 4.0).
Export terminals show in orange, import terminals in blue, with modelled great-circle flow lines between them. The panel on the right carries the live Henry Hub gas price and a snapshot of the network, 1,187 terminals in all, 365 operating, around 496 MTPA (million tonnes per annum) of export capacity against 1,190 MTPA of import. The Ask Genie box answers plain-English questions and highlights the terminals it finds.
I can ask a question like ‘Show all operating LNG export terminals in Qatar’, and I can start to explore those terminals geospatially:
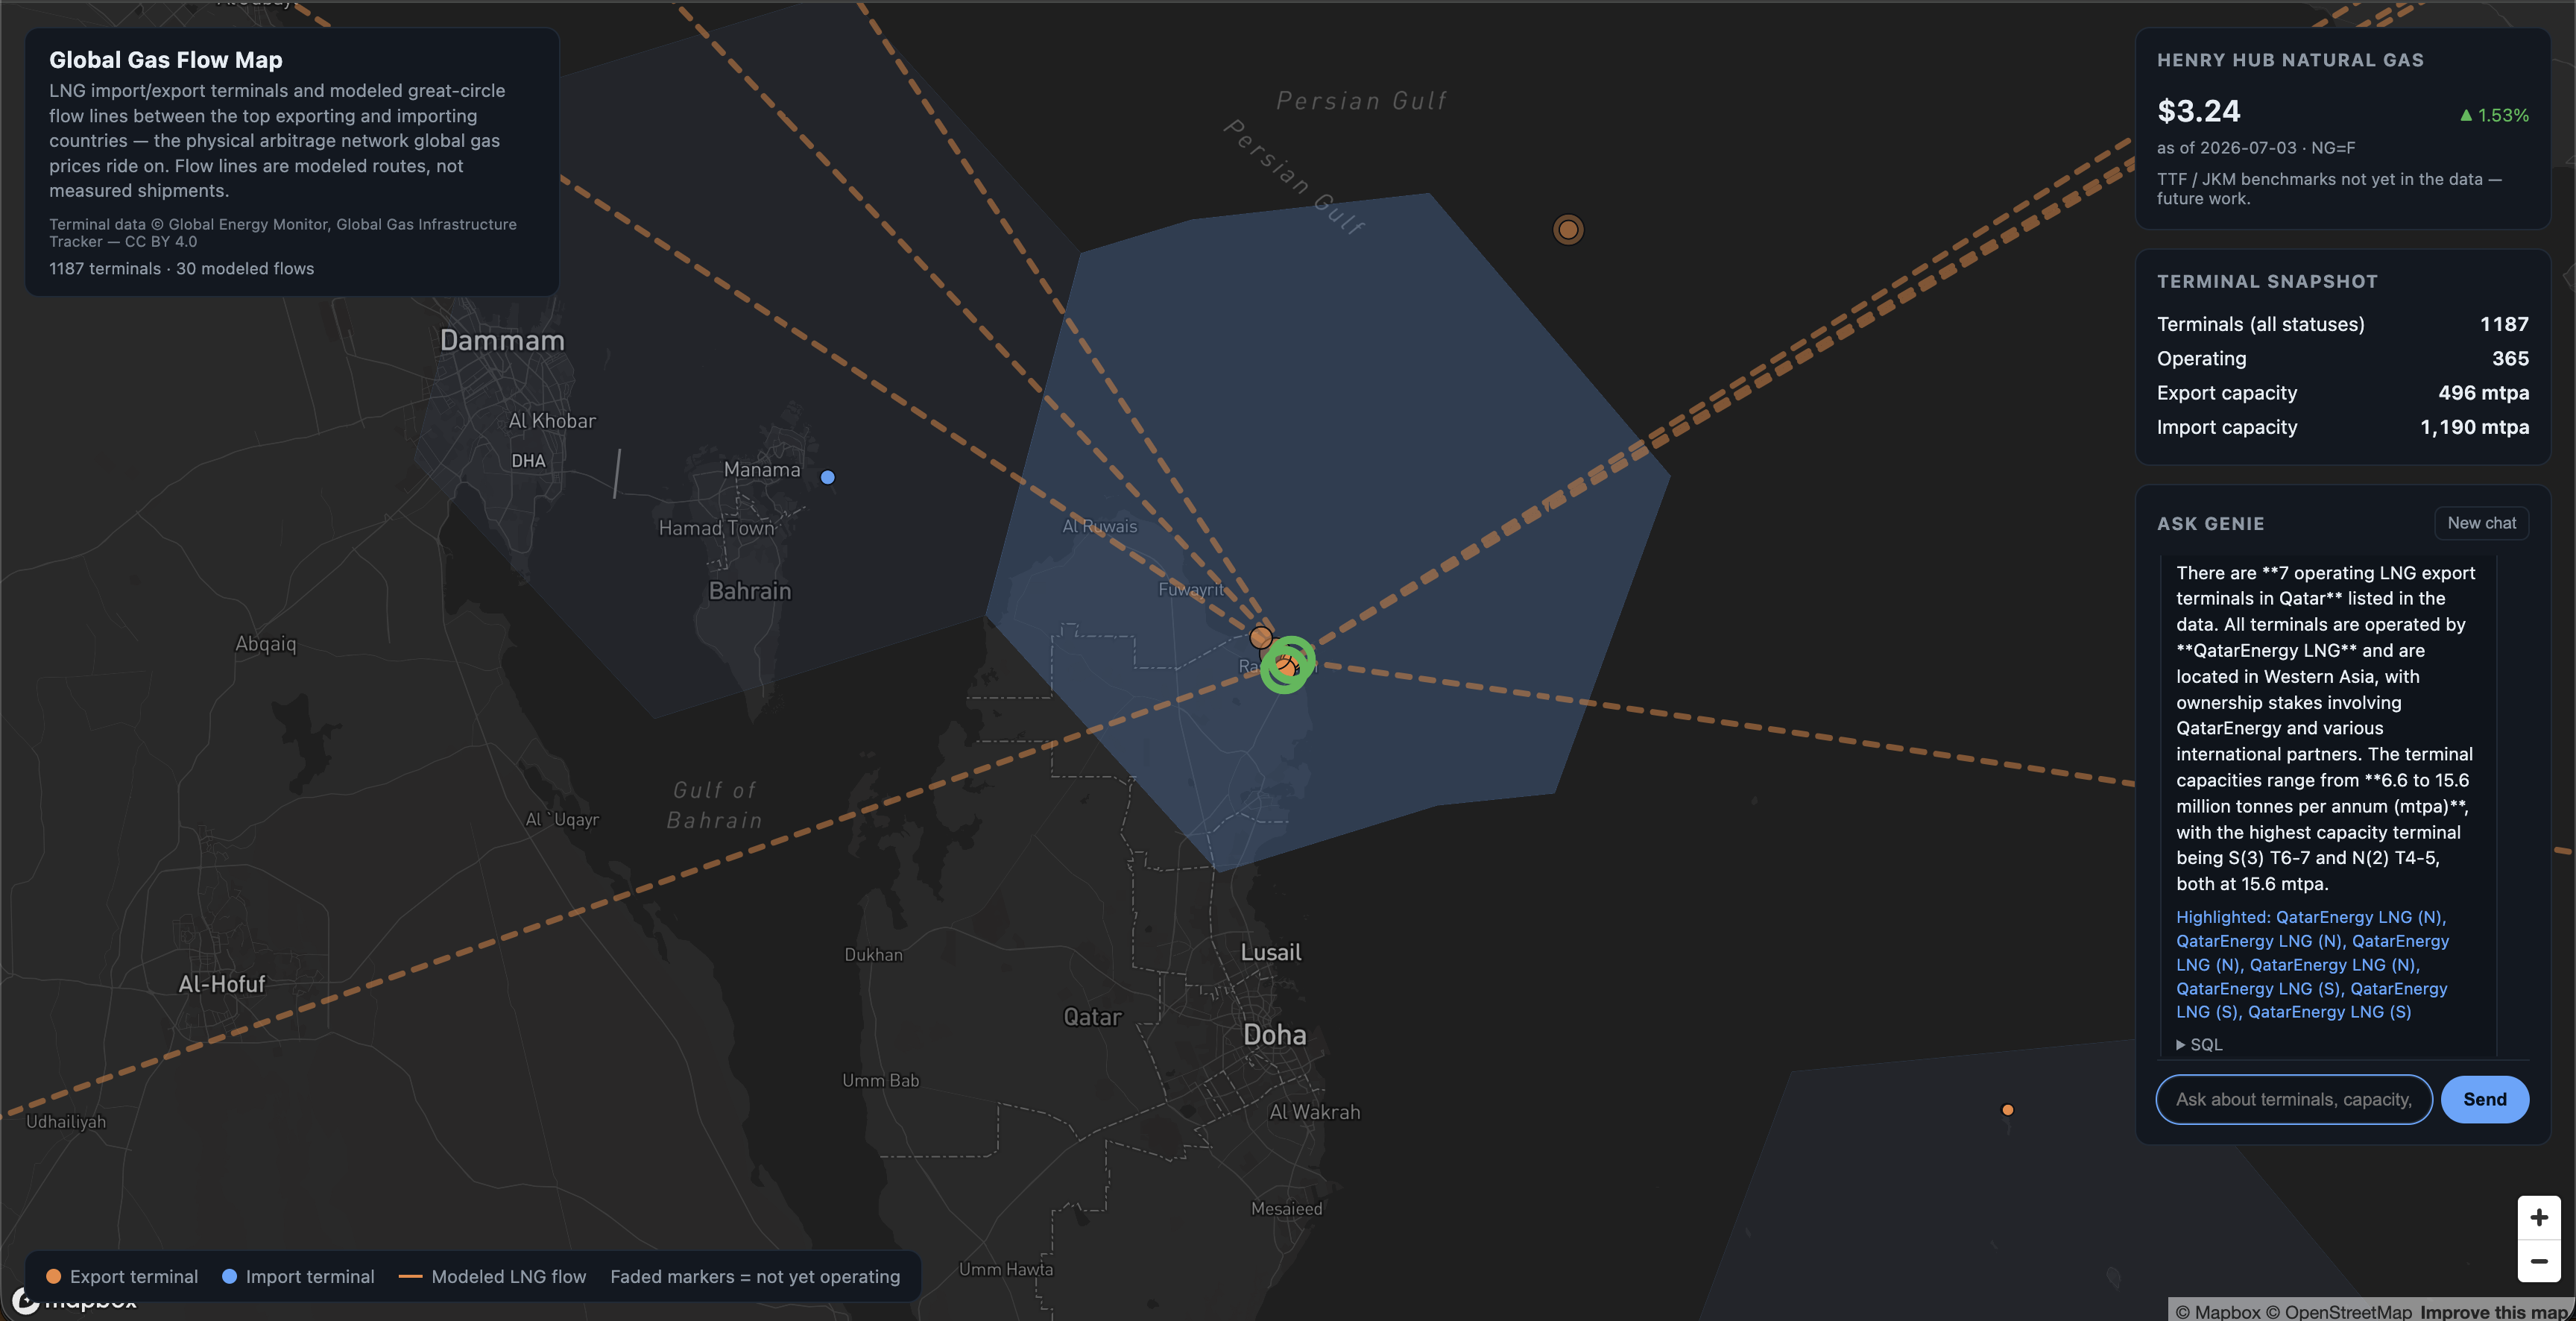 Asking Genie for Qatar’s operating LNG export terminals. It answers in the sidebar, highlights the matching terminals on the map, and zooms to them.
Under the hood, Genie translates the question into SQL, runs it against the lakehouse tables, and hands the matching terminals back to the map, which highlights them and zooms in. Here it found the seven operating QatarEnergy export terminals in the dataset, clustered around Ras Laffan, Qatar’s main LNG export hub.
Conclusion
Omnigent was just one of many announcements this year at DAIS, but I think it could solve a really important problem around orchestrating multiple agent harnesses and collaborating with agents. A couple of other noteworthy features we did not cover are MCP support and custom agents. I plan to continue using and testing Omnigent in the coming months.
I hope the energy example was relevant and inspires you to go and use your own subject matter expertise to build some exciting things on Databricks and beyond.
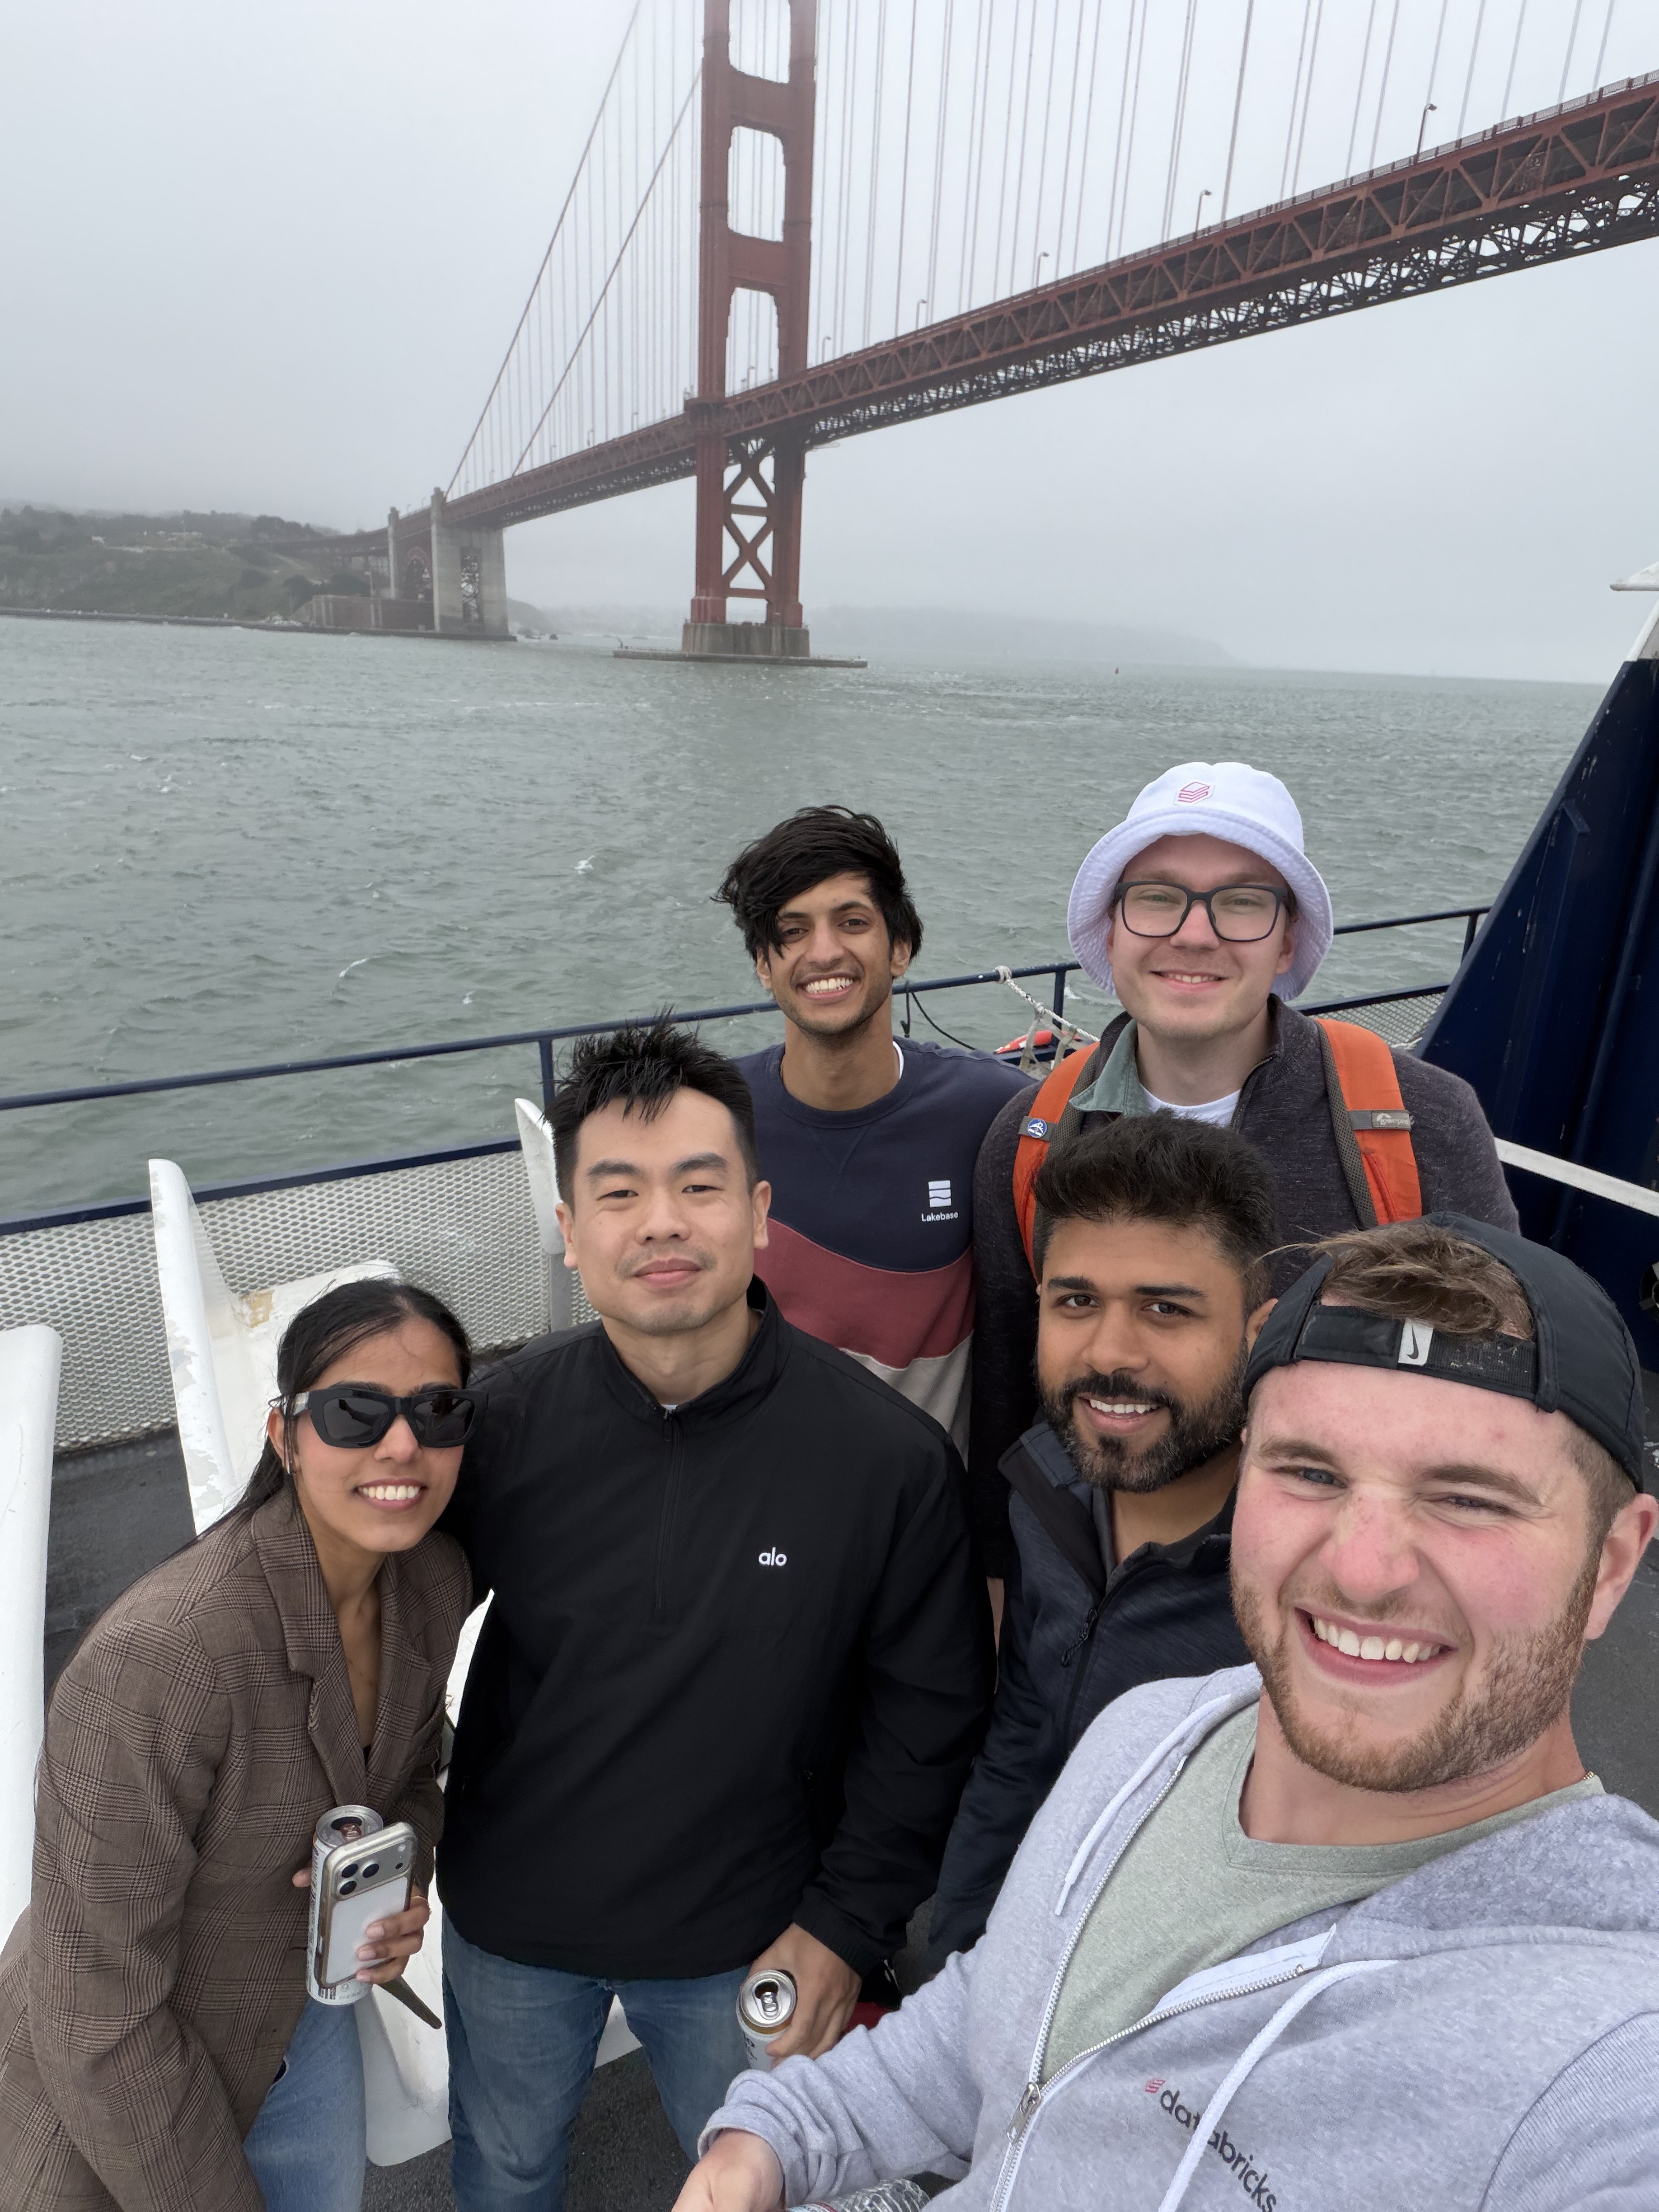
I had a great time at DAIS in San Francisco this year. A few highlights from the trip:


Thanks for reading!