
🗺️ Mapping the Permian with Claude and Databricks

Working with the folks over at Collide in Texas inspired me to build this project to learn the concepts and tooling they were leveraging. They are doing lots of amazing work in the oil and gas space with AI and process automation. If you’re interested in learning more about the business of oil and gas and how tech intersects with the energy industry, check out their podcast: Collide Podcast on YouTube.
Introduction
I have been having a blast over the last few weekends, vibe‑coding and leveraging Claude Code with Sonnet 4.6 and the ai-dev-kit from Databricks to build some interesting applications geared towards midstream oil and gas.
I had been relatively skeptical of vibe coding up until a few weeks ago, and, self‑admittedly, have not done a ton of it. I have been a bit underwhelmed by tools like GitHub Copilot, and I don’t seem to be the only one. Scrolling through Reddit, I found a post as recent as 4 months ago. The author claimed that Copilot’s code quality had “significantly dropped” over the past few months, even when using Claude Sonnet 4.5 inside VS Code.
And that sentiment isn’t isolated. There are multiple threads where developers describe Copilot as excellent for boilerplate and quick inline suggestions, but inconsistent when it comes to deeper reasoning, multi-file refactors, or nuanced debugging.
But my skepticism around vibe coding largely stemmed from those early Copilot experiences. The suggestions often felt like autocomplete on steroids rather than a true thinking partner. If that’s your baseline experience, it’s easy to dismiss the whole category.
At Plains, we’re collaborating with commercial teams to unlock value from our data lake datasets. I wanted to prototype something visually compelling. A geospatial app that would demonstrate the power of combining structured data, unstructured contracts, and maps. And who doesn’t love geospatial data?!
I thought to leverage Claude Code and the new Databricks ai-dev-kit to generalize what we have started building at Plains for the purpose of this blog post. I also wanted to take the opportunity to test out ai-dev-kit and generate synthetic data for features and functionality that are both aspirational and that we have actually built out internally to demonstrate what we can do once we have all the data landed and modeled within our data lake. I appreciate the synthetic data is not perfectly accurate to what we would see in the field, but it is not bad given it was generated using Claude and the Databricks MCP server.
We have many of our datasets landed in the data lake, so although the data itself is proprietary, the patterns and tooling we are building are broadly applicable. For this post I generalized it into a synthetic Permian Basin dataset for things like wells, crude and gas pipelines, acreage dedications, processing plants, and compressor/pump stations and built a full interactive mapping application on top of it, all running on Databricks.
The Use Case
We are seeing a large amount of data being locked away in unstructured contracts. Like I mentioned in a previous post, the ‘oil and gas industry is burdened by complex contracts that are often lengthy, unstructured, and scattered across various formats’, and we have built several capabilities internally at Plains to OCR, extract structured information, and query said data at scale and in one recent example exceeding 25,000 contracts. Contract data in isolation is useful for compliance and record keeping. Contract data connected to a geospatial context becomes a strategic asset, especially when you pair it with other geospatial datasets to visualize pipelines, wells, and in the unstructured contract example, acreage dedications which are inherently spatial. They define where volumes are contractually committed across counties, basins, and lease blocks.
A commercial analyst may know things like the contract start and end date, the operator’s name, and the minimum volume commitment (MVC), but other questions might be a bit more difficult. Things like:
- Where does that acreage physically sit relative to our pipelines?
- Is production in that block trending up or declining?
The goal was to generate synthetic data like data sources I have seen in the energy industry like Enverus, pipeline data modelled in PODS, acreage dedication contracts etc. and demonstrate how we geospatially visualize this data in an easy to use and understand map interface, allowing the commercial team to answer tough questions like:
‘What does this contract mean spatially, operationally, and competitively?’
What Was Built
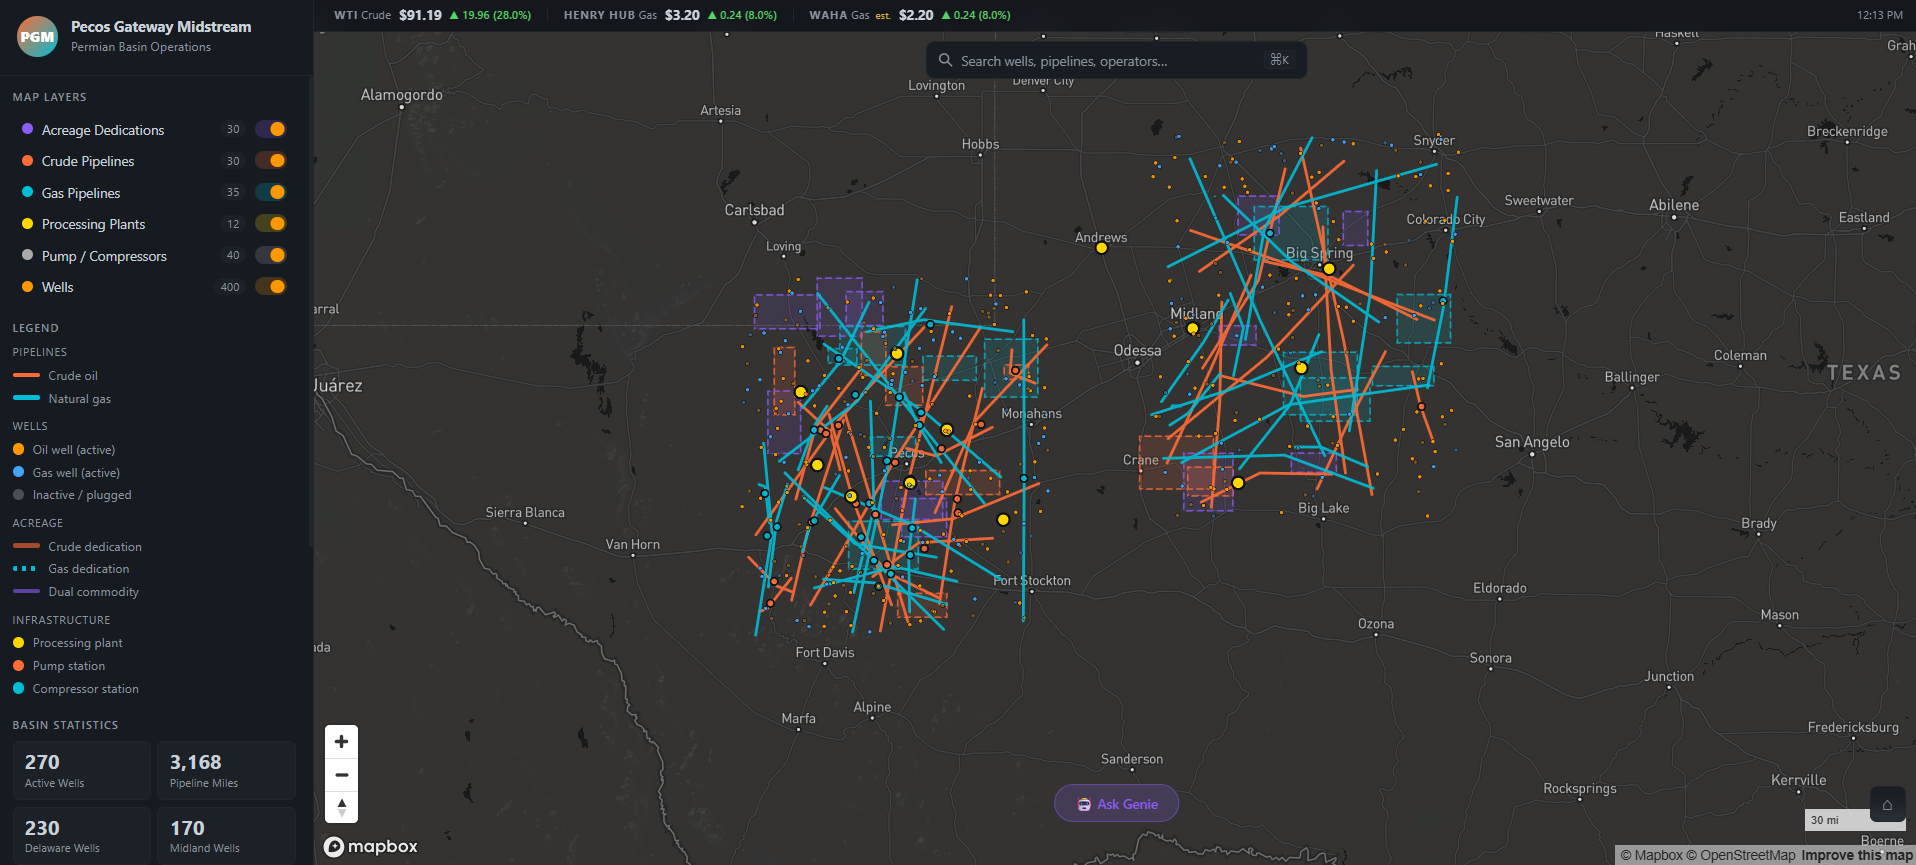
The app was built to directly answer those use case questions. An analyst can pull up the map, click on an acreage dedication to see its spatial footprint relative to pipelines, check whether nearby wells are producing strongly or declining, open the linked contract PDF, and query across all of it in plain English, all without leaving Databricks. Specifically:
- “Where does that acreage sit relative to our pipelines?” → acreage dedication and pipeline layers are overlaid on the same map, making spatial relationships immediately visible.
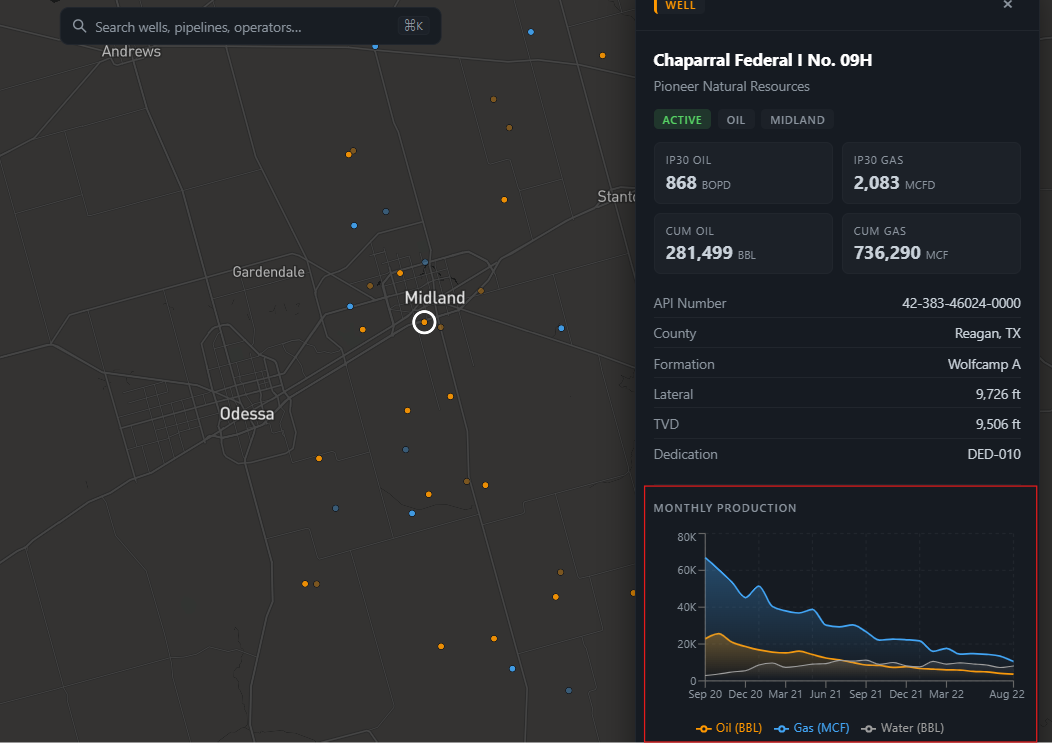
- “Is production trending up or declining?” → clicking any well surfaces a BBL/MCF time-series chart pulled live from Unity Catalog.
- “What does this contract actually say?” → clicking an acreage block opens the linked PDF contract directly in the app.
A lot of the boilerplate and foundational software components were in place before vibe coding began. I had already decided on a language and framework (React + Node.js), a mapping library (Mapbox GL), where I was going to host it (Databricks Apps), and how the app would authenticate and query data (Unity Catalog via a SQL warehouse). Having those decisions locked in upfront meant Claude wasn’t being asked to make architectural choices and instead it was being asked to build features within a well-defined structure. That’s a meaningful distinction. Vibe coding works best when the AI is filling in the what, not deciding the how.
The app is a React + Mapbox GL frontend served by an Express.js backend, deployed as a Databricks App. All the operational data lives in Unity Catalog and is queried at runtime through a SQL warehouse. The data being represented on the map is coming from a mix of structured and unstructured datasets. I have learned over the past 6 months that people really seem to like viewing data on a map. Geospatial data can be incredibly powerful and can help tell a cool story.
The choice of React + Mapbox GL was deliberate. Mapbox is the closest thing to an industry standard for interactive geospatial work outside of enterprise tools like Esri. It handles GeoJSON layers, dynamic filters, and camera animations natively, and react-map-gl gives you a clean component wrapper around it.
Express.js was chosen because it lets you serve both the React single-page app and all the API routes from a single Node.js process, which maps cleanly to how Databricks Apps works. One command, one process, no separate infra.
Bringing the app to the data (rather than extracting data to an external host) was a conscious decision: the Express server runs inside Databricks, which means it authenticates to Unity Catalog natively using the injected OAuth token with no data leaving the platform.
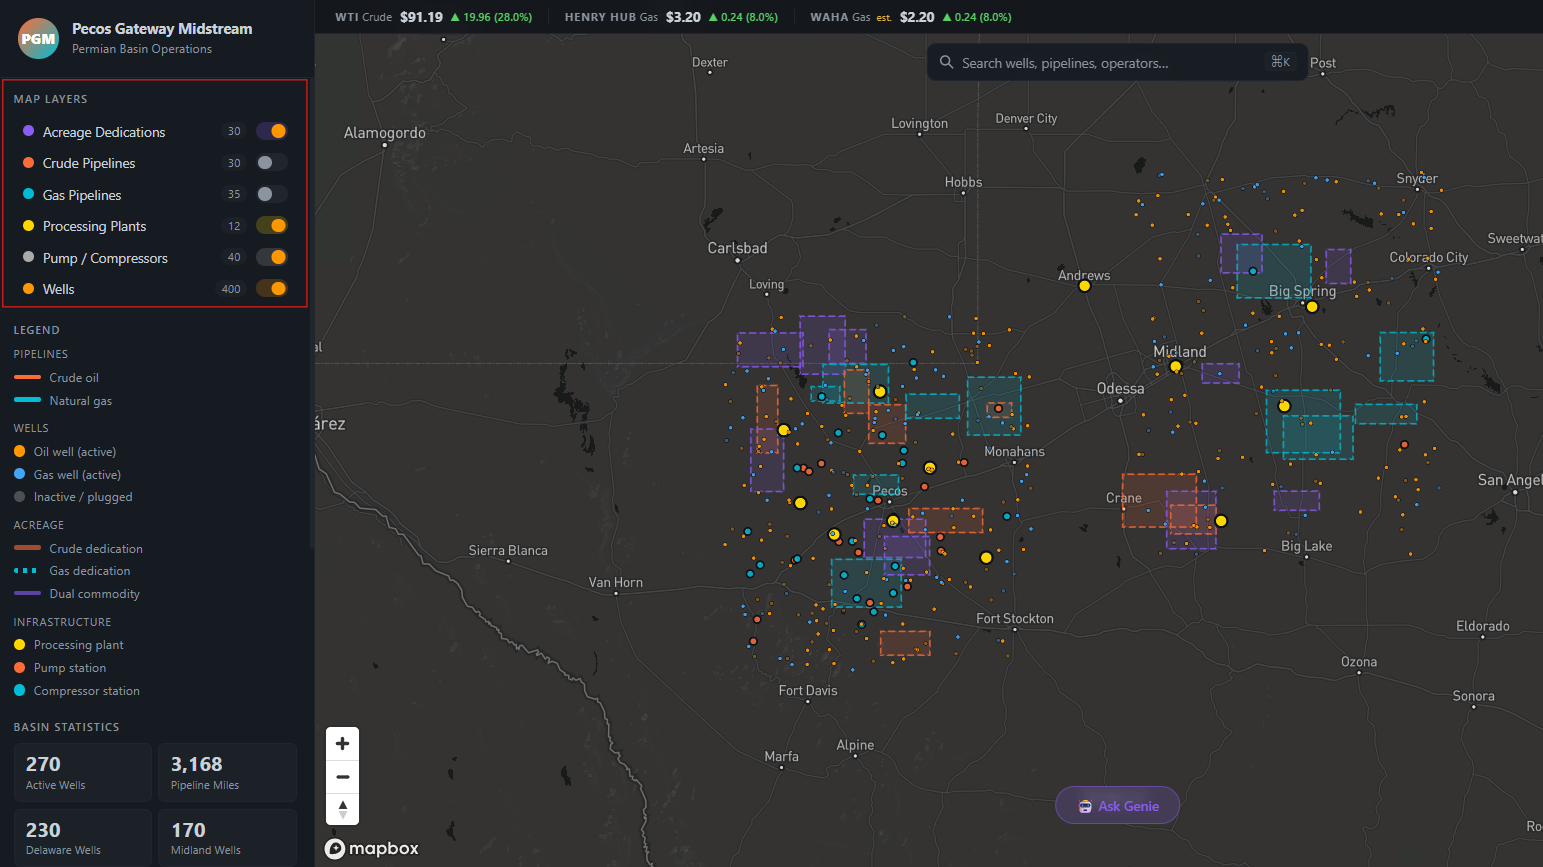
Every layer of the map can be interacted with, including:
- Wells
- Crude and gas pipelines
- Acreage dedications
- Compressor/pump stations
- Processing plants
Results are cached in-memory for 5 minutes so navigating around the map doesn’t re-query the warehouse on every interaction.
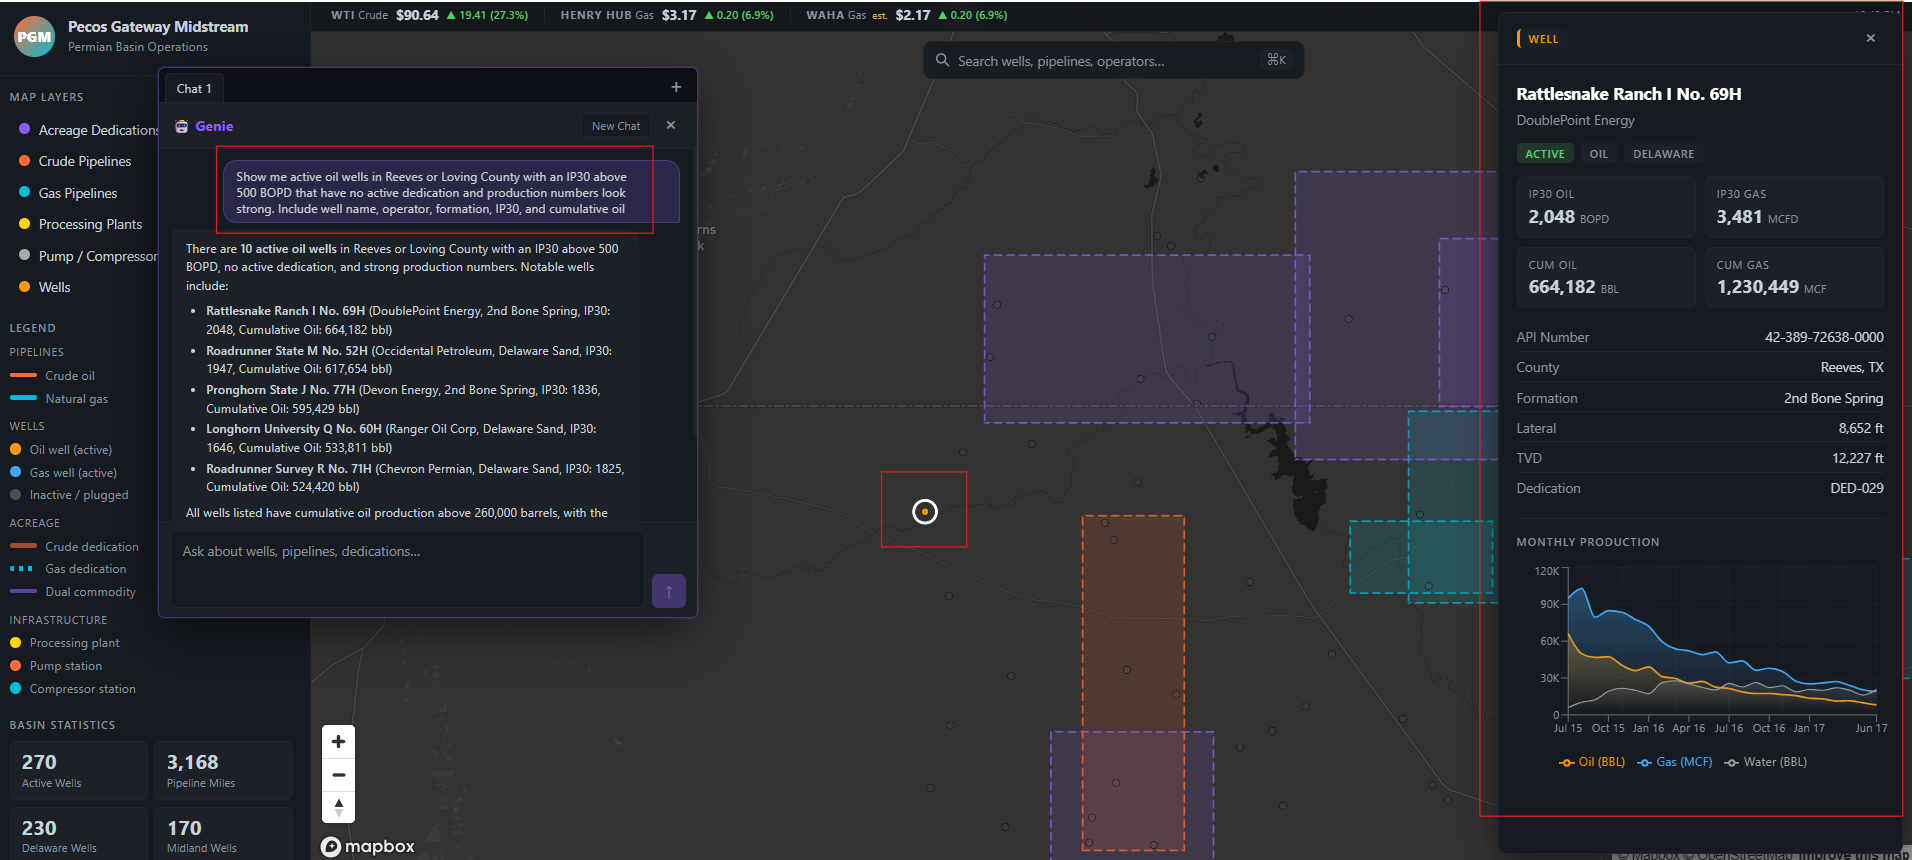
Similar to a dataset like Enverus, we can view well production history in a time-series chart to get an idea for BBL and MCF being produced from a given well.
We also integrated the geospatial experience with Genie, where a user can ask questions like:
‘Which acreage blocks have no active contracts, show their locations?’
Genie will interact with the tables in Unity Catalog and once a response is returned, the corresponding acreages will be highlighted on the map for exploration:
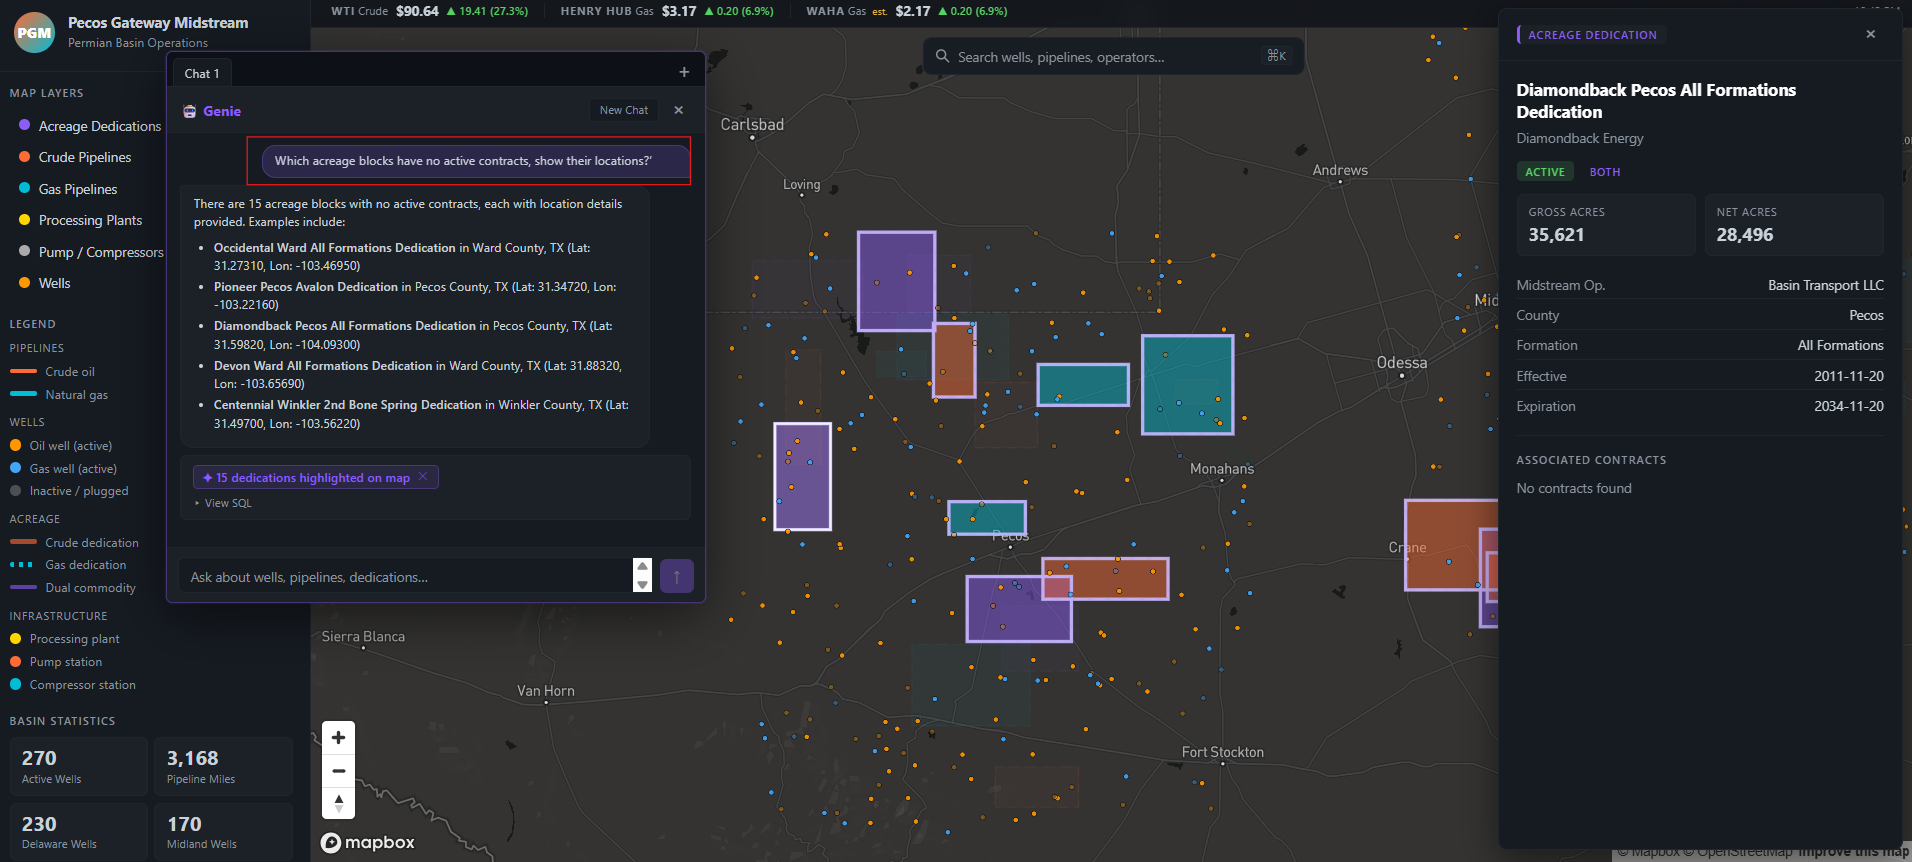
Getting the results from Genie to highlight on the map was a fun challenge. Genie generates SQL against Unity Catalog, the server re-executes that query via the warehouse, extracts the matching well or acreage IDs from the result, and passes them back to the frontend so Mapbox can highlight just those features while dimming everything else on the map.
Another cool query I was playing around with:
‘Show me active oil wells in Reeves or Loving County with an IP30 above 500 BOPD that have no active dedication and production numbers look strong. Include well name, operator, formation, IP30, and cumulative oil’
I leveraged the ai-dev-kit (i.e. Databricks MCP server) heavily to create objects within Databricks. Things like Catalogs, Schema, and Tables were all created and populated using natural language in Claude Code. I asked Claude Code to do things like:
‘Create some dummy PDF contracts, upload them to a Databricks volume in the Permian catalog, and link to them in the app when selecting an acreage dedication, and open the PDF within the app’
…which allowed me to quickly generate dummy data and link it directly into the interface I was building:
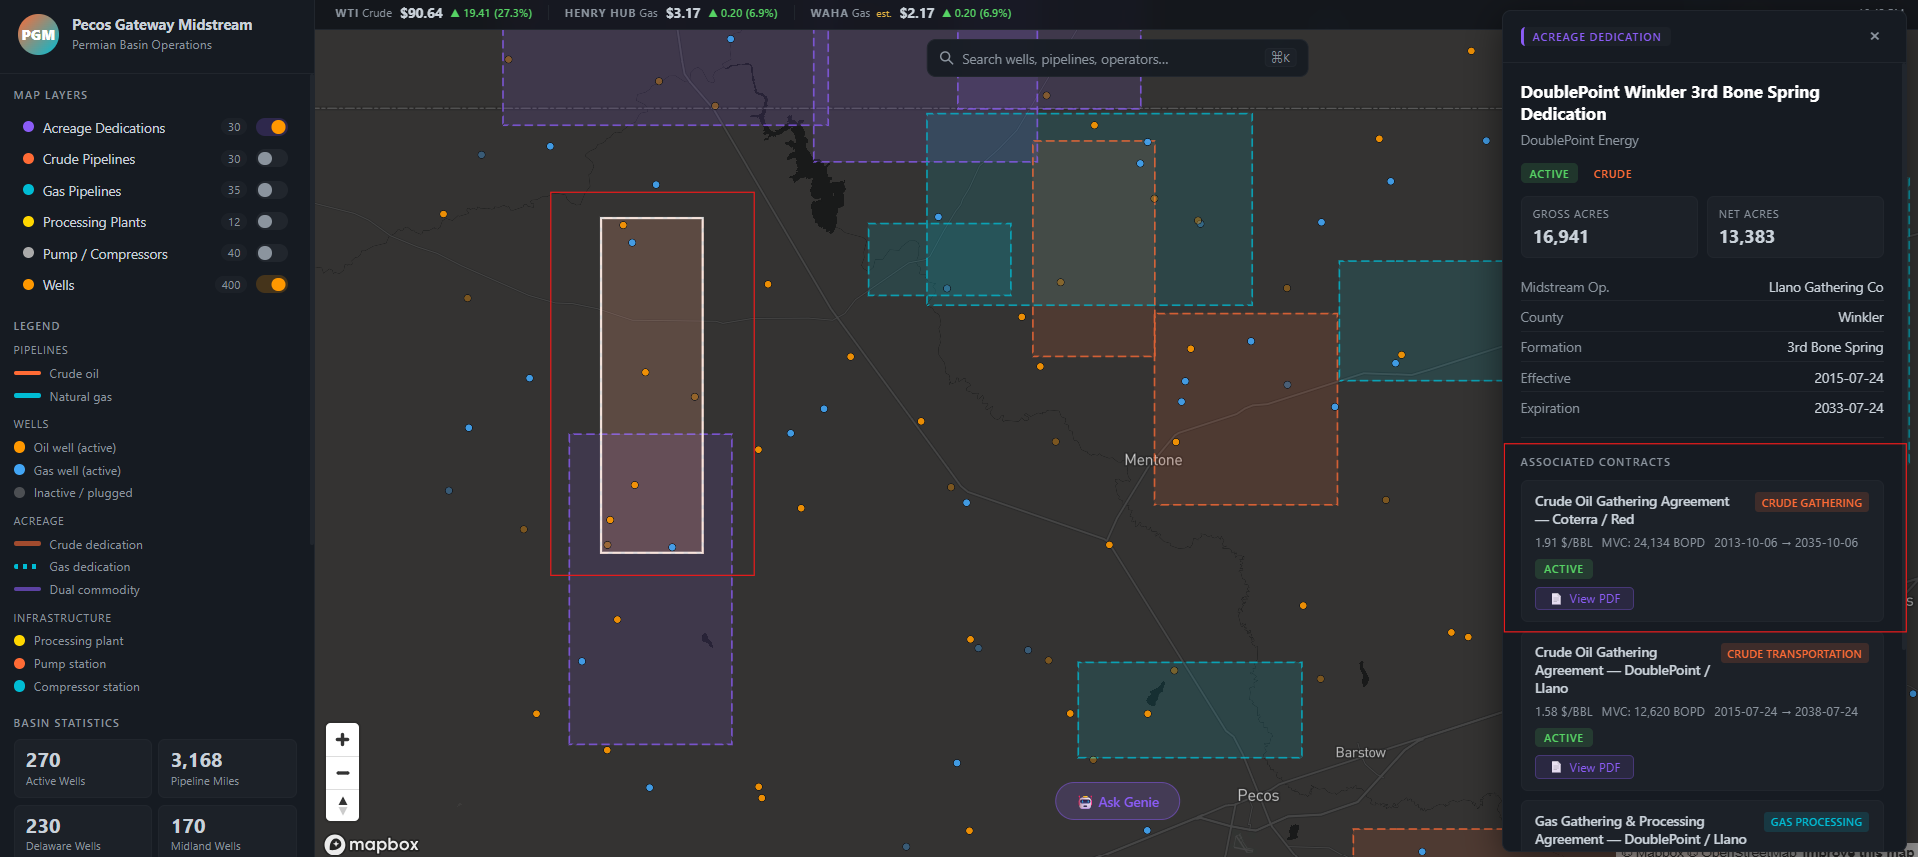
Opening one of those associated contracts reveals some pretty convincing dummy data:
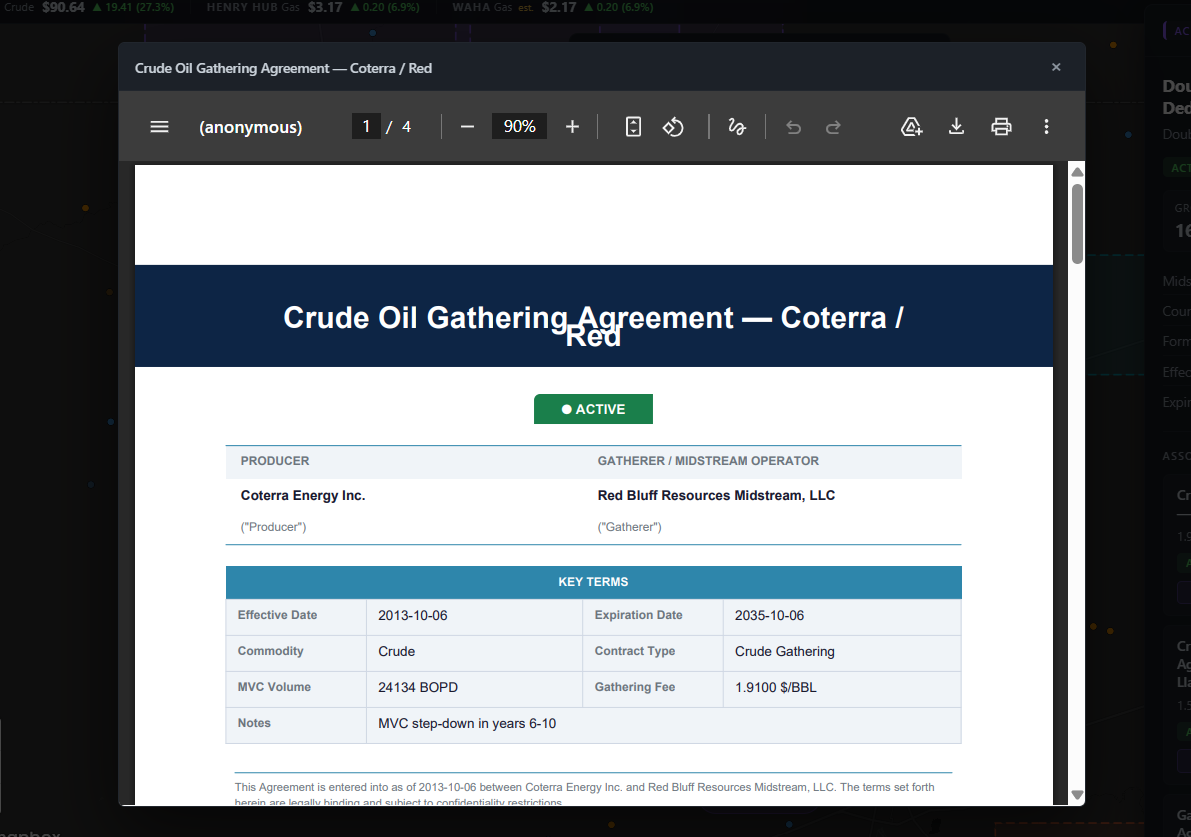
The dummy data generated is not perfect and you will notice in the above screenshots there are things like overlapping acreage dedications, but I think overall Claude and its integration with the Databricks MCP server did a solid job.
Conclusion
My eyes have been opened leveraging tools like Claude Code and the new ai-dev-kit from Databricks to quickly prototype applications. So long as you understand how the Databricks platform works and the sequence of steps you need to orchestrate, you can guide Claude to build some cool stuff on Databricks.
Lessons Learned
I attempted to leverage Claude to deploy my JavaScript application to Databricks Apps and it did not work very well.
The deployment failure was the most instructive moment of the whole project. I asked Claude to deploy the Node.js app to Databricks Apps before I fully understood the steps myself. After several failed attempts I had to step in, manually work out the correct deployment sequence, and only then delegate the automation of that process back to Claude to create a GitHub Actions pipeline to automate the process of deploying the app going forward. That pattern generalized well: Claude is a force multiplier once you understand the problem space, but it will struggle when you don’t understand the platform well enough to verify its output.
A few other things I’d keep in mind for next time:
- The MCP server excels at data operations: Creating catalogs, schemas, tables, uploading data to volumes, but is less reliable for platform infrastructure tasks like app deployment, at least right now.
- Decide on your stack before vibe coding begins: Having already chosen React + Mapbox GL + Express freed Claude to focus on building features rather than making architectural decisions.
- Synthetic data is awesome for prototyping: Being able to ask Claude to generate realistic contracts and well data and load them directly into Unity Catalog via MCP collapsed what would have been days of data prep into minutes.
What’s Next
The synthetic Permian dataset served its purpose for this post, but the real value unlocks when this runs on actual data. As more of our datasets land in the data lake, swapping out the synthetic layer is a straightforward schema change. A few things are on the roadmap beyond that:
- Pass-through authentication: so the app respects Unity Catalog row-level permissions, a user should only see the contracts and acreage dedications they’re entitled to.
- Extending to other basins: the Permian is the proof of concept, but the same architecture applies anywhere we have pipeline and contract data.
- Tighter Genie integration: to support more complex, multi-step analytical workflows directly from the map.
- Contracts tab: to quickly view and search contract details and filter by operator, county, and AI‑generated contract summaries.
I think this application is a great example of the power of Databricks Apps running on the Databricks platform. There is huge value in bringing the apps to the data, instead of the data to the apps.
Thanks for reading 😀!