
🛢️🤖 Why Detecting O&G Pipeline Anomalies Is So Hard
Disclaimer:
PI data, pipeline sensor data, and the operational use cases around them are areas I’m actively learning. There are experts at Plains and across the industry who know this inside out. I’m approaching this from a technical perspective, and it’s a complex topic. This blog is meant to capture ideas and lessons from others while helping me solidify my own understanding. I’ve done my best to ensure accuracy, but please treat this as a learning perspective rather than authoritative guidance.
👋 Introduction
Over the past few months, I’ve been diving into the world of pipeline operations and the rich data that comes from them. I have grown a huge appreciation for how complex these systems are. The sensors along these pipelines generate massive amounts of data, tracking flow, pressure, temperature, vibration, and more, every second of every day. Interpreting this data is far from straightforward and understanding how to extract meaningful insights is both fascinating and challenging.
I recently had some great conversations with Scott McKean on the complexities of operational anomaly detection in pipelines. We also have an incredibly knowledgeable OT team at Plains who have been patient in explaining topics like over/short, inhibits, triggers, and more. It has been and will continue to be a humbling learning experience.
This space sits at the intersection of engineering, operations, and data science. There are some interesting data and AI problems here and I’m excited to continue exploring this space and sharing insights along the way.
🧩 Anomaly Detection Complexity
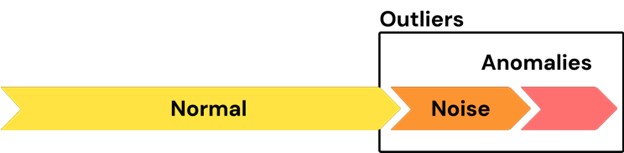
There is a lot that happens on an oil and gas pipeline, and it is far more complicated than just monitoring a few pressure and flow readings. Pipeline data is never static, and the pipeline system is constantly responding to external factors like temperature and pressure changes, and various operational decisions. So, while anomaly detection in many industries looks for outliers, in pipelines the definition of “normal” is always shifting. Sifting through ‘noise’ (weak outliers) and ‘anomalies’ (strong outliers) can be very difficult.
From what I have learned thus far, here are a few of the major factors that make the task of detecting anomalies so difficult.
Side note:
Scott has a great blog on anomaly detection and is definitely worth checking out.
🌡️ The Pipeline System is Always Changing
Hydrocarbons inside a pipeline expand and contract with temperature and pressure, and this stored compression is known as linepack. When a pipeline shuts down, pumps stop, pressure bleeds off, and the product settles. The measured volume can suddenly look different from what the system says should be there. This temporary difference is often called an over/short imbalance, and it can look almost identical to other operational issues like leaks or metering errors. Without accounting for linepack and how pressure and temperature shifts affect volume, even a good anomaly detection model will throw constant false positives.
This is why basic volume imbalance checks are unreliable the moment temperature swings, shutdowns, or other transient events happen.
📘 Why Linepack and Transients Break Simple Imbalance Detectors
Pipelines do not behave like static tanks. They act more like long, flexible storage vessels. As pressure increases, the pipe walls and the product inside compress, storing additional volume as linepack. During real operations, this is always changing as pumps ramp, temperatures shift, valves move, and product batches travel down the line. Because of this, the actual volume inside a pipeline at any moment is not fixed and can’t be inferred from flow meters alone.
Transient events make this even more obvious. Startup, shutdown, pump trips, valve changes, and temperature swings all shift linepack faster than simple models expect. A basic imbalance detector that just looks at flow in versus flow out ends up interpreting these changes as apparent losses or gains. To a naive model, those look like leaks. In reality, they are perfectly normal behaviors. This is why modern leak detection systems and anomaly detection approaches need to understand operating context, pressure and temperature behavior, and the physical dynamics of the pipeline rather than relying on static thresholds.
🔀 Multiple Pumps and Split Flows Add Signal Complexity
Pipelines are not linear “point A to point B” systems, and they often include multiple pumping stations, branch lines that split the product into different paths and potential recombination points downstream.
Each pump also introduces changes in the pipeline like pressure, flow, vibrations and transient behavior like shutdowns.
If flow in ≠ flow out → anomaly will generate a false positive every time.
These pipeline systems are incredibly complex.
🔔 Triggers and Inhibits Make the Operational Context Dynamic
Pipeline safety systems rely on automated logic and there are a few terms I have learned about in the past few weeks:
- Triggers: Conditions that automatically generate alerts to the control center for operator review and decision-making (e.g., high pressure)
- Inhibits: Temporary overrides that prevent those alerts when abnormal readings are expected (e.g., during startup or maintenance)
During startup, shutdown, pigging, and maintenance, inhibits are often active and from an operations standpoint we are saying ‘Yes, conditions look abnormal, but we expect that, so don’t respond.’
For anomaly detection models, this is incredibly hard. The model must also know when to ignore anomalies (i.e., the noise). This means the key is not just analyzing the sensor values but understanding the operating state at that moment.
💸 False Positives Can be Expensive
If an anomaly detection system signals a leak incorrectly and triggers or pressures teams to shut down, and if the system cries wolf too often, it simply gets ignored, which is worse than having no system at all. An incorrect flag could lead teams to shut down a pipeline segment:
- Product stops moving across large distances
- Field crews may be dispatched to remote terrain
- Downstream contracts and storage logistics are interrupted
- The cost can escalate into hundreds of thousands of dollars per hour
🛠️ Our Initial Approach
Before having a good understanding of all the above factors, we originally started tackling this as an unsupervised learning problem, specifically leveraging isolation forest and this seemed very appealing since we did not need to label events, and it did a decent job at detecting anomalies. We ran into some stark limitations right off the bat. Isolation forest only tells you that an anomaly occurred, not what changed or what the anomaly could be. It produces an anomaly score, but it doesn’t reveal which signal, feature, or condition triggered that score.
Isolation forest is not great since all you get is if an anomaly is detected or not and not what was detected. Being able to explain to the operational teams ‘why’ an alert was triggered is important to build trust and continuously improve the model through the practice of MLOps.
📐 Recognizing the Multi-Dimensional Nature of the Problem
The next thing I learned came from taking a step back and looking at the data from a physical standpoint.
A single flow rate or pressure signal cannot tell the whole story. Pipelines are multi-dimensional systems that are influenced by many variables including things like flow rate (volume movement), pressure (linepack, pump load, blockages, restrictions), vibration (pump condition and mechanical signatures), amongst other things. The behavior of any one signal only makes sense in context with the others. After understanding this, we moved away from isolation forest to an ensemble model to help us tackle the multi-dimensional nature of this problem.
📊 Shifting to Classification Models (e.g., XGBoost)
Once we understood the operating patterns, we moved toward supervised and semi-supervised classification, where the model learns to identify operating states and anomaly types, not just differences. This is where classification models (like XGBoost) became a much better fit.
Instead of asking, “Is this point different from normal?” (Isolation Forest), we instead ask, does this data pattern match one of the following:
- normal operation,
- shutdown conditions, or
- a potential leak?
This framing is much more aligned with how pipeline operators think.
🧪 Using Synthetic Data to Train the Classifier
To wrap my head around how to technically do this, I thought of generating some synthetic pipeline data to learn how to do this.
| State | What’s Happening Physically | Why It Matters for Modeling |
|---|---|---|
| Normal Operation | Pumps running steady, linepack stable | Establishes the baseline “normal” pattern the model must learn |
| Shutdown Conditions | Flow and pressure bleed down, pumps slow, valves close | A naturally abnormal-looking state that should not be treated as a threat |
| Leak Scenario | Pressure drops while flow and vibration increase | The critical anomaly we want the model to reliably detect |
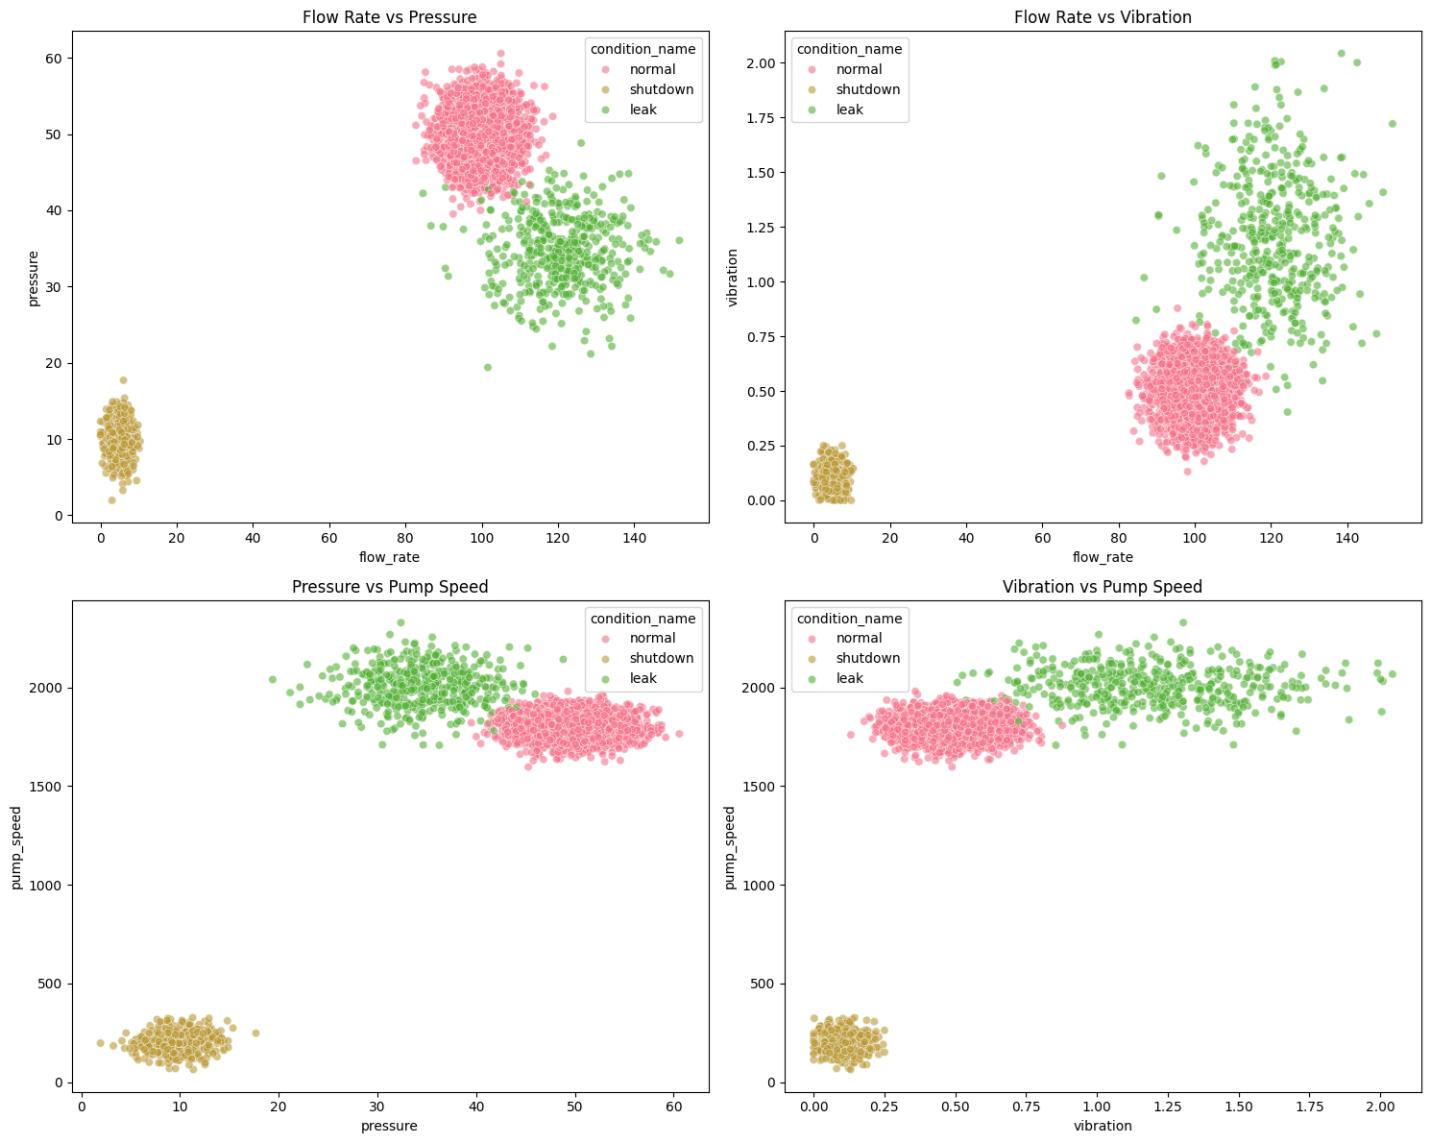
We generated these states by sampling from realistic ranges of flow rate, pressure, temperature, vibration, pump speed, and valve position, each representing a different part of pipeline behavior.
We validated how well (or not) the feature engineering went by leveraging EDA techniques to understand the relationship between the features. As I understand it, the less overlap between features, the better. In the below example, you can see some plot overlaps between normal and shutdown which could lead to false positives. Also, in retrospect, I wish I did not display balanced (i.e., normal) flow in red 😂.
⏭️ Next Steps
The ML model is just one piece of broader operational architecture. The output needs to be trusted, repeatable, and actionable across hundreds of pipeline systems with different equipment, environmental conditions, and product characteristics.
We’re approaching the next stage in three main areas:
🤝 Pairing ML Models with a Rule-Based Engine
While the classification model helps interpret multi-sensor patterns, pipeline operations still rely on deterministic safety logic that cannot be replaced. So instead of choosing between ML or rules, the goal is to combine them:
| Component | Role in the System |
|---|---|
| Rule-Based Engine | Handles explicit operating constraints and known alarm conditions (e.g., high-pressure trip, pump vibration alarm). These rules already exist and are trusted by operations. |
| Classification Model (e.g., XGBoost) | Looks across multiple signals to interpret the broader operating state and detect subtle or emerging anomalies that rules do not capture. |
| Operating Context Layer | Ensures alerts are only considered during meaningful states (e.g., ignore anomaly-like signals during startup or pigging because inhibits and transitions are expected). |
This approach reduces false positives while maintaining operational trust, something purely ML-driven anomaly detection rarely gets right on the first try.
🗂️ Model Governance and Lifecycle Management
To move beyond proof-of-concept, we need consistent versioning, reproducibility, and centralized governance:
| Tool | Purpose |
|---|---|
| MLflow | Track training runs, feature configurations, and performance metrics. Ensures we know what changed when improving models. |
| Unity Catalog | Provides versioning, permission control, and lineage for both models and features. This is key to auditability and cross-team adoption. |
| Feature Store / Feature Engineering Layer | Ensures features like “pressure delta over 10 minutes” are computed once, consistently, everywhere. |
🚦 Data & Pipeline Orchestration at Scale
The data pipeline itself matters as much as the model:
- We ingest PI tag data (and related historian telemetry).
- We cleanse, align timestamps, and compute features.
- We classify operating state + evaluate for anomalies.
- We push outputs to dashboards and alerting systems.
To manage this at operational scale, we are evaluating Lakeflow Declarative Pipelines to orchestrate:
Ingestion → Tag Aggregation → Feature Computation → Model Inference → Alert Routing
And last, but certainly not least, continue working with our OT teams to encode operational playbooks into the context layer.
Thanks for reading 😊