
🎨🧑🎨 The Art of Keeping Things Simple: Data Quality
Who doesn’t love talking about data quality?
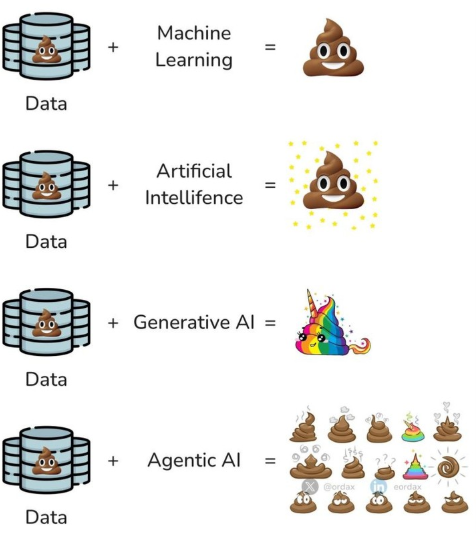
It may not be the most exciting topic right now (or ever), but it certainly is very important. I am sure we have all seen the meme below circling around online, but it is so true and it demonstrates the importance of high-quality data.
Mark van der Linden and I have had many conversations about this and he always says, ‘never use data unless you understand its quality’, and that goes for the full stack. Reporting, analytics, and especially all kinds of AI.
Looking back, I’ve jumped headfirst into use cases more times than I’d like to admit without truly grasping the data’s quality upfront. Had I prioritized that early, I would’ve avoided a ton of rework, set more realistic expectations with stakeholders, and delivered better outcomes faster.
Data quality issues often tell a compelling story. When you surface gaps or inconsistencies to business owners and collaborate on root-cause fixes, like process changes that improve capture at the source, it turns a technical problem into a shared opportunity for improvement. Stakeholders get bought in, and the data gets better.
Full disclosure, I haven’t gone deep into dedicated data quality tooling yet, but I’ve always been intrigued by enterprise solutions like Informatica Data Quality.
That said, this ties directly into the philosophy Mark and I explored in our recent post The Art of Keeping Things Simple. Heavy tools bring specialized skills, complex licensing, and yet another vendor to manage, exactly the kind of over-engineering we argued against.
So, why not keep things simple? We’re experimenting with embedding a lightweight, SQL-based data quality engine directly into Data Weaver on Databricks. The goal: stay within a single, unified framework (Databricks + SQL/Python) for ingestion, transformation, orchestration, and quality checks, no extra layers, no context-switching.
Use Case
I always like to ground technical solutions in business value. It’s easy for us as technologists to forget why these systems exist in the first place. Let’s talk about the use case we are looking at to build some DQ rules.
In a recent post, I talked a bit about getting data out of mainframe for a series of commercial focused use cases we are working on. Mostly, we’re dealing with volumetric receipt and delivery data at the contract level (i.e., what are our contractual volumetric commitments). We also pull in data from our scheduling system to verify if those committed volumes have been scheduled (i.e., ensuring logistics are in place for timely and accurate scheduling of oil and gas deliveries), as well as our crude oil accounting system for the volumetric actuals.
To expand this further, we’re integrating third-party data from Enverus, a leading provider of energy analytics. Enverus supplies granular insights into production forecasts, well performance, and market trends, which we layer onto our internal datasets. This helps us validate contractual commitments against external benchmarks, like regional production averages or competitor activity. For instance, we can cross-check our volumetric data against Enverus’ well-level production estimates to spot discrepancies early, such as over- or under-estimated reserves that might impact contract viability.
A key area where this shines is in handling acreage dedications. In the oil and gas space, acreage dedications lock in specific land areas (often measured in acres or sections) to a midstream contract, committing all production from that acreage to a particular pipeline, gatherer, or processor. Our data quality engine scrutinizes these dedications by validating spatial and volumetric alignments:
- Are the dedicated acres accurately mapped to contracts?
- Do production actuals from those acres match the dedicated commitments?
We flag issues like overlapping dedications (e.g., the same acreage tied to multiple contracts) or mismatches between dedicated volumes and historical output, which could lead to legal or operational risks.
This ties directly into right-sizing contracts based on historical actuals. By analyzing trends in actual deliveries from our accounting system, spanning months or years, we can recommend adjustments to contractual minimum volume commitments (MVCs) or take-or-pay clauses. For example, if historical actuals show consistent under-delivery on a dedicated acreage block (perhaps due to declining well productivity, as corroborated by Enverus data), we can simulate scenarios to “right-size” the contract:
- Reduce MVCs to avoid penalties
- Renegotiate terms for flexibility
- Even release underperforming acreage from dedications
This not only optimizes costs but also aligns commitments with real-world performance, reducing exposure to shortfall fees.
Full disclosure: much of the above is still aspirational. We’ve built pieces of this today, but not the entire end-to-end vision yet. What matters most at this stage isn’t the completeness of the technology, it’s deeply understanding the business of scheduling, marketing, and contract management. Once you truly understand how volumes flow, how commitments are made, and where real-world constraints live, it becomes much clearer what is and isn’t possible from a technical standpoint. The technology follows the business, not the other way around.
SQL Based Data Quality Engine
Now let me put my propellor hat back on and talk about some tech!
Rather than introducing a standalone data quality platform, we opted for a lightweight, SQL-first data quality engine embedded directly into our Databricks workflows. The guiding principle is simple: data quality should live where the data already lives, using tools the team already understands.
At its core, the engine follows a three-table design inspired by dimensional modeling patterns. The goal is to separate what we are checking from how often issues occur and where they occur, enabling both high-level monitoring and deep operational investigation.
Three-table design:
- dq_dim_rule (Dimension Table)
- Defines each data quality rule with metadata
- Fields:
RuleId,Area,ShortName,LongName
- dq_fact_rule_summary (Fact Table - Aggregated)
- Stores daily aggregate counts per rule
- Fields:
Id(auto-increment),RuleId,Count,Date - Provides high-level metrics for dashboards and trending
- dq_fact_rule_detail (Fact Table - Granular)
- Stores individual DQ violations per rule
- Fields:
Id(auto-increment),RuleId,ContractId,Date - Enables drill-down investigation of specific problem data.
The Databricks notebook runs daily to:
- Delete existing detail records for each rule and current date
- Calculate violations by querying source tables (
receipt_data,delivery_data,scheduling_data) - Insert both summary counts and detailed contract IDs for each rule
- Track data quality trends over time with the date dimension
This is where data engineers, analysts, and business users go when they want to understand which contracts are problematic and why.
Execution Pattern
A daily notebook in Databricks orchestrates all checks and follows a consistent, idempotent pattern:
- Remove existing records for each rule and the current processing date
- Execute SQL logic to identify violations across source systems:
- Receipt data
- Delivery data
- Scheduling data
- Insert:
- Aggregated violation counts into the summary table
- Individual contract violations into the detail table
- Persist results with a date dimension to enable historical trending
This approach ensures the job can be safely re-run, supports incremental rule additions, and keeps the entire framework transparent and auditable.
We’ve implemented several foundational rules so far, such as:
- Contracts missing receipt or delivery volumes
- Spot deals with incomplete or missing date ranges
- Mismatches between scheduled and actual volumes
Today, these results are surfaced through Databricks AI/BI dashboards, giving stakeholders real-time visibility into how data quality evolves over time, rather than treating it as a one-off validation exercise.
Conclusion
What this approach has reinforced for us is that meaningful data quality work doesn’t require heavyweight platforms, complex rule engines, or yet another vendor to manage. In many cases, it simply requires:
- Clear business context
- Well-understood data
- And a disciplined, repeatable way to surface issues
By embedding data quality checks directly into our Databricks pipelines using SQL and Python, we’ve kept quality close to the data, close to the engineers, and most importantly close to the business questions that matter.
This approach won’t replace enterprise data quality platforms in every scenario, nor is it meant to. But for teams already operating in a modern lakehouse environment, it offers a pragmatic, low-friction way to start treating data quality as a first-class citizen, without over-engineering the solution.
In a future blog we will talk about data profiling, specifically a tool in Data Weaver that provides the ability to rapidly profile data to quickly get a feel for the quality of the data.
Thanks for reading 😀